## Scatter Plot: Relationship Between Deep-Thinking Ratio and Accuracy (Pass@1)
### Overview
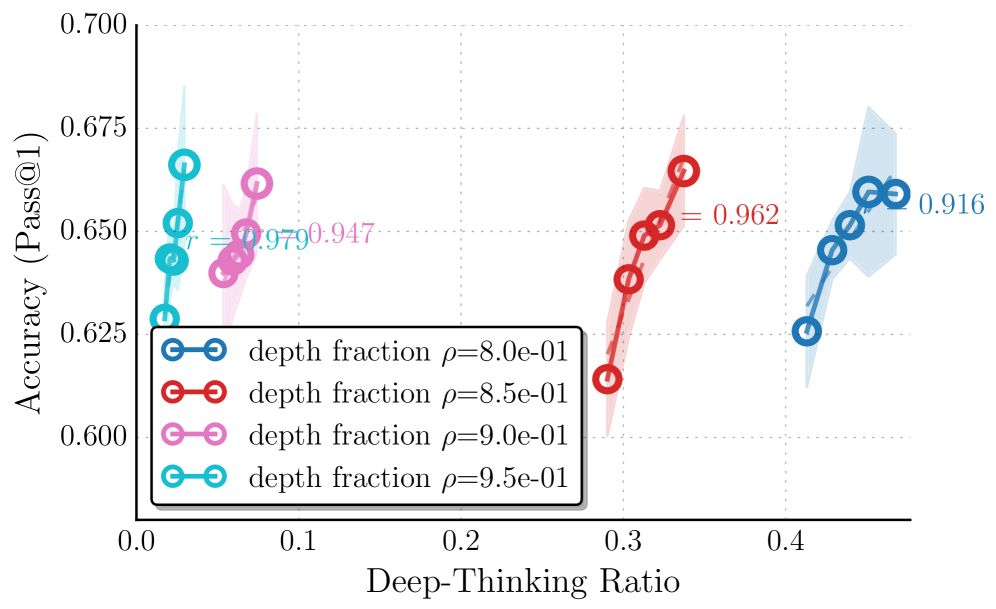
The image is a scatter plot showing the relationship between **Deep-Thinking Ratio** (x-axis) and **Accuracy (Pass@1)** (y-axis). Four distinct data series are represented by different colors, each corresponding to a specific **depth fraction** (ρ). Each series includes a trend line and a correlation coefficient (r) indicating the strength of the relationship. The plot highlights how accuracy varies with the deep-thinking ratio across different depth fractions.
---
### Components/Axes
- **X-axis (Deep-Thinking Ratio)**: Ranges from 0.0 to 0.45, with increments of 0.1.
- **Y-axis (Accuracy (Pass@1))**: Ranges from 0.6 to 0.7, with increments of 0.025.
- **Legend**: Located in the **bottom-left corner**, mapping colors to depth fractions:
- **Blue**: depth fraction ρ = 8.0e-1
- **Red**: depth fraction ρ = 8.5e-1
- **Pink**: depth fraction ρ = 9.0e-1
- **Cyan**: depth fraction ρ = 9.5e-1
- **Trend Lines**: Each data series has a linear regression line with a labeled correlation coefficient (r).
---
### Detailed Analysis
#### Data Series and Trends
1. **Blue Series (ρ = 8.0e-1)**:
- **Data Points**:
- (0.0, 0.65), (0.1, 0.64), (0.2, 0.63), (0.3, 0.62), (0.4, 0.61)
- **Trend**: Slight downward slope (r = 0.979).
- **Observation**: Accuracy decreases marginally as the deep-thinking ratio increases.
2. **Red Series (ρ = 8.5e-1)**:
- **Data Points**:
- (0.2, 0.63), (0.25, 0.64), (0.3, 0.65), (0.35, 0.66)
- **Trend**: Strong upward slope (r = 0.962).
- **Observation**: Accuracy increases significantly with higher deep-thinking ratios.
3. **Pink Series (ρ = 9.0e-1)**:
- **Data Points**:
- (0.05, 0.64), (0.1, 0.65), (0.15, 0.65)
- **Trend**: Flat (r = 0.947).
- **Observation**: Accuracy remains stable across the range of deep-thinking ratios.
4. **Cyan Series (ρ = 9.5e-1)**:
- **Data Points**:
- (0.0, 0.62), (0.1, 0.63), (0.2, 0.64), (0.3, 0.65), (0.4, 0.66), (0.45, 0.67)
- **Trend**: Strong upward slope (r = 0.916).
- **Observation**: Accuracy increases consistently with higher deep-thinking ratios.
---
### Key Observations
- **Correlation Strength**:
- Blue (ρ = 8.0e-1) and Red (ρ = 8.5e-1) series show the strongest correlations (r = 0.979 and 0.962, respectively).
- Cyan (ρ = 9.5e-1) has the weakest correlation (r = 0.916), despite a clear upward trend.
- **Accuracy Trends**:
- Higher depth fractions (e.g., ρ = 9.5e-1) generally show higher accuracy at higher deep-thinking ratios.
- The Red series (ρ = 8.5e-1) exhibits the most pronounced improvement in accuracy with increasing deep-thinking ratio.
- **Overlap and Variability**:
- Data points for different series overlap in the lower-left quadrant (e.g., 0.0–0.1 deep-thinking ratio).
- The Cyan series (ρ = 9.5e-1) has the highest accuracy at the maximum deep-thinking ratio (0.45, 0.67).
---
### Interpretation
The data suggests that **higher depth fractions** (e.g., ρ = 9.5e-1) are associated with **greater accuracy** at higher deep-thinking ratios, though the relationship varies in strength. The **Red series (ρ = 8.5e-1)** demonstrates the most consistent and significant improvement in accuracy as the deep-thinking ratio increases, while the **Blue series (ρ = 8.0e-1)** shows a slight decline. The **Cyan series (ρ = 9.5e-1)**, despite a strong upward trend, has a weaker correlation, possibly due to higher variability or external factors.
The plot implies that **deep-thinking ratio** is a critical factor in determining accuracy, but its impact depends on the **depth fraction**. Depth fractions closer to 0.9 (e.g., ρ = 8.5e-1, 9.0e-1) show more predictable relationships, while extreme values (e.g., ρ = 8.0e-1, 9.5e-1) may introduce noise or diminishing returns. This could inform optimization strategies for balancing depth and computational efficiency in systems relying on deep-thinking processes.