## Chart Type: Line Graphs Comparing ACC and ECE
### Overview
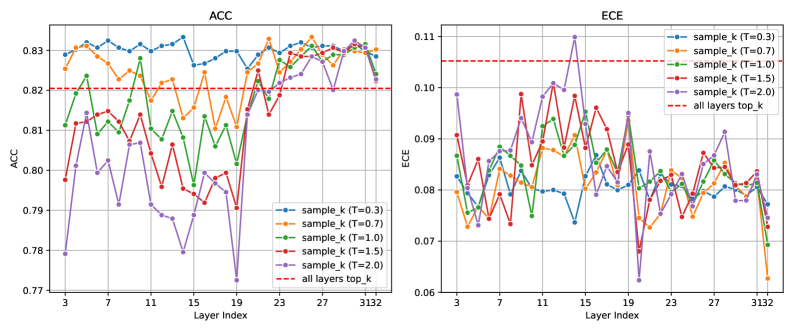
The image contains two line graphs side-by-side. The left graph displays "ACC" (Accuracy) values across different "Layer Index" values. The right graph displays "ECE" (Expected Calibration Error) values across the same "Layer Index" values. Both graphs compare different configurations of "sample_k" with varying temperature parameters (T=0.3, T=0.7, T=1.0, T=1.5, T=2.0) and a baseline "all layers top_k".
### Components/Axes
**Left Graph (ACC):**
* **Title:** ACC
* **Y-axis:** ACC, ranging from 0.77 to 0.83 in increments of 0.01.
* **X-axis:** Layer Index, with markers at 3, 7, 11, 15, 19, 23, 27, and 3132.
* **Legend (Top Right):**
* Blue: sample_k (T=0.3)
* Orange: sample_k (T=0.7)
* Green: sample_k (T=1.0)
* Red: sample_k (T=1.5)
* Purple: sample_k (T=2.0)
* Dashed Red: all layers top_k
**Right Graph (ECE):**
* **Title:** ECE
* **Y-axis:** ECE, ranging from 0.06 to 0.11 in increments of 0.01.
* **X-axis:** Layer Index, with markers at 3, 7, 11, 15, 19, 23, 27, and 3132.
* **Legend (Top Right):**
* Blue: sample_k (T=0.3)
* Orange: sample_k (T=0.7)
* Green: sample_k (T=1.0)
* Red: sample_k (T=1.5)
* Purple: sample_k (T=2.0)
* Dashed Red: all layers top_k
### Detailed Analysis
**Left Graph (ACC):**
* **sample_k (T=0.3) - Blue:** Starts around 0.83, remains relatively stable with minor fluctuations, ending around 0.83.
* **sample_k (T=0.7) - Orange:** Starts around 0.83, fluctuates, and ends around 0.83.
* **sample_k (T=1.0) - Green:** Starts around 0.81, fluctuates, and ends around 0.82.
* **sample_k (T=1.5) - Red:** Starts around 0.81, fluctuates, and ends around 0.82.
* **sample_k (T=2.0) - Purple:** Starts around 0.78, fluctuates, and ends around 0.82.
* **all layers top_k - Dashed Red:** Remains constant at approximately 0.82.
**Right Graph (ECE):**
* **sample_k (T=0.3) - Blue:** Starts around 0.08, fluctuates, and ends around 0.08.
* **sample_k (T=0.7) - Orange:** Starts around 0.08, fluctuates, and ends around 0.07.
* **sample_k (T=1.0) - Green:** Starts around 0.08, fluctuates, and ends around 0.08.
* **sample_k (T=1.5) - Red:** Starts around 0.09, fluctuates, and ends around 0.08.
* **sample_k (T=2.0) - Purple:** Starts around 0.10, fluctuates, and ends around 0.07.
* **all layers top_k - Dashed Red:** Remains constant at approximately 0.105.
### Key Observations
* In the ACC graph, sample_k with T=0.3 and T=0.7 consistently perform well, closely followed by all layers top_k. Sample_k with T=2.0 starts lower but converges towards the others as the layer index increases.
* In the ECE graph, sample_k with T=2.0 has the highest initial error but decreases significantly. The "all layers top_k" baseline has a relatively high and constant ECE.
* The Layer Index 3132 is significantly larger than the other layer indices, suggesting a potential change in the model architecture or training process at that point.
### Interpretation
The graphs suggest that different temperature parameters (T) in the "sample_k" configuration affect both the accuracy (ACC) and the expected calibration error (ECE) of the model. Lower temperature values (T=0.3, T=0.7) generally lead to higher accuracy, while higher temperature values (T=2.0) initially result in lower accuracy but improve over layers. The "all layers top_k" baseline provides a stable accuracy but exhibits a higher calibration error compared to some "sample_k" configurations. The significant jump in Layer Index to 3132 might indicate a transition to a different stage of the model or a final aggregation layer, where the performance metrics tend to converge. The choice of the optimal temperature parameter depends on the desired trade-off between accuracy and calibration error.