## Line Graphs: Accuracy (ACC) and Expected Calibration Error (ECE) Across Layers
### Overview
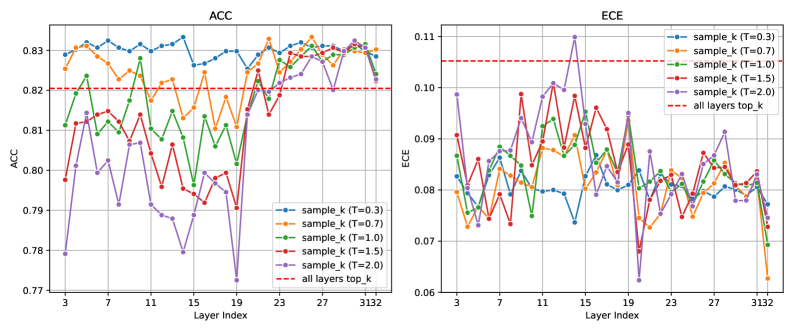
The image contains two line graphs comparing model performance metrics (ACC and ECE) across 3132 layers. Each graph shows five data series representing different temperature (T) values (0.3, 0.7, 1.0, 1.5, 2.0) and a dashed reference line labeled "all layers top_k". The graphs reveal how sampling strategies and temperature settings affect model behavior.
### Components/Axes
**ACC Graph (Left):**
- **X-axis**: Layer Index (3 to 3132)
- **Y-axis**: Accuracy (ACC) from 0.77 to 0.83
- **Legend**: Right-aligned, color-coded for T values (blue=T=0.3, orange=T=0.7, green=T=1.0, red=T=1.5, purple=T=2.0) and dashed red line for "all layers top_k"
**ECE Graph (Right):**
- **X-axis**: Layer Index (3 to 3132)
- **Y-axis**: Expected Calibration Error (ECE) from 0.06 to 0.11
- **Legend**: Identical to ACC graph, with dashed red line at 0.10
### Detailed Analysis
**ACC Trends:**
- All T values (blue, orange, green, red, purple) fluctuate between **0.79–0.83**, maintaining proximity to the dashed reference line at **0.82**.
- Notable dips occur at layer 15 (T=0.3: ~0.79) and layer 19 (T=2.0: ~0.78), but values recover quickly.
- T=2.0 (purple) shows the most volatility, with sharp rises and falls.
**ECE Trends:**
- Lines exhibit significant volatility, with T=2.0 (purple) peaking at **0.11** (layer 15) and **0.105** (layer 27).
- T=0.3 (blue) and T=0.7 (orange) generally stay below **0.09**, while T=1.5 (red) and T=2.0 (purple) frequently exceed **0.095**.
- The dashed reference line at **0.10** acts as a benchmark; only T=2.0 consistently surpasses it.
### Key Observations
1. **ACC Stability**: All T values maintain high accuracy (~0.82) across layers, with minimal deviation from the reference line.
2. **ECE Volatility**: Higher T values (1.5, 2.0) correlate with increased calibration error, particularly in later layers (e.g., layer 27: T=2.0 spikes to 0.105).
3. **Layer-Specific Anomalies**:
- Layer 15: T=0.3 (ACC: ~0.79) and T=2.0 (ECE: ~0.11) show extreme deviations.
- Layer 19: T=2.0 (ACC: ~0.78) dips sharply but recovers by layer 23.
### Interpretation
- **Accuracy vs. Calibration Tradeoff**: While accuracy remains stable across configurations, ECE reveals that higher temperatures (T=1.5, 2.0) introduce overconfidence in predictions, leading to poor calibration. This suggests that while sampling more layers (via higher T) may improve accuracy, it risks miscalibrating confidence estimates.
- **Reference Line Significance**: The "all layers top_k" method (dashed red) serves as a baseline. In ECE, it highlights that simpler sampling strategies (lower T) better align with expected error bounds.
- **Practical Implications**: For applications requiring reliable uncertainty estimation (e.g., safety-critical systems), lower T values (0.3–1.0) may be preferable despite slightly lower accuracy. The volatility in ECE for high T values warns against over-reliance on confidence scores in such scenarios.
**Note**: All values are approximate, derived from visual inspection of line positions relative to gridlines and axis markers.