## Line Graph: Accuracy vs. Sample Size (k)
### Overview
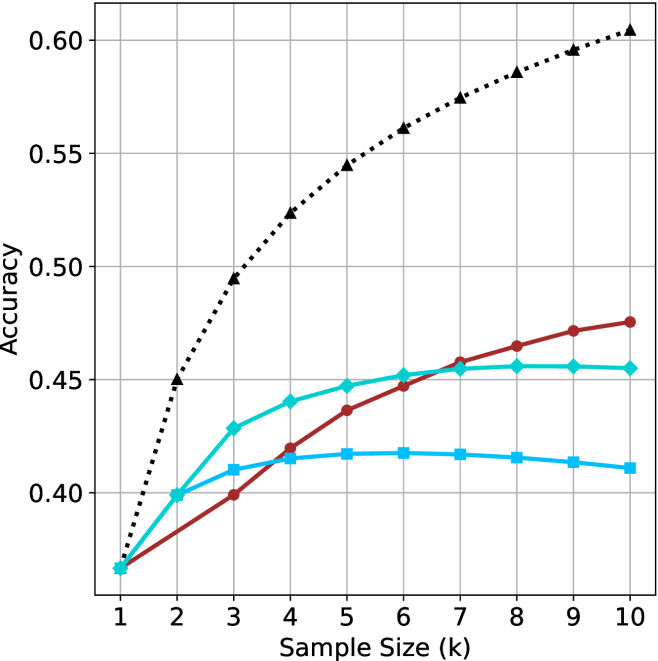
The graph compares the accuracy of three methods (Method A, Method B, Method C) across sample sizes ranging from 1 to 10. Accuracy is measured on the y-axis (0.35–0.60), while the x-axis represents sample size (k). Three distinct lines represent the methods, with Method A (black dotted) showing the highest accuracy trend.
### Components/Axes
- **X-axis**: "Sample Size (k)" with integer markers from 1 to 10.
- **Y-axis**: "Accuracy" with increments of 0.05 from 0.35 to 0.60.
- **Legend**: Located on the right, with:
- **Method A**: Black dotted line.
- **Method B**: Red solid line.
- **Method C**: Blue solid line.
### Detailed Analysis
1. **Method A (Black Dotted Line)**:
- Starts at (1, 0.35) and increases steadily.
- Reaches 0.50 at k=4, 0.55 at k=7, and 0.60 at k=10.
- **Trend**: Linear growth with no plateau.
2. **Method B (Red Solid Line)**:
- Begins at (1, 0.35), rises to 0.44 at k=5, then plateaus.
- Peaks at 0.47 at k=9 and remains stable at k=10.
- **Trend**: Initial growth followed by stabilization.
3. **Method C (Blue Solid Line)**:
- Starts at (1, 0.35), peaks at 0.43 at k=3, then plateaus.
- Remains at 0.45–0.46 from k=6 to k=10.
- **Trend**: Early rapid growth, then flat performance.
### Key Observations
- **Method A** consistently outperforms others, especially at larger sample sizes (k ≥ 7).
- **Method B** and **Method C** show diminishing returns after k=5 and k=3, respectively.
- All methods start at identical accuracy (0.35) for k=1, suggesting baseline performance parity.
### Interpretation
The data suggests **Method A** scales most effectively with increasing sample size, achieving near-optimal accuracy (0.60) at k=10. In contrast, **Method B** and **Method C** exhibit early saturation, indicating limited benefit from larger samples beyond mid-range values. This could imply that Method A’s algorithm or design is better suited for high-dimensional or complex datasets, while B and C may prioritize efficiency over scalability. The plateau in B and C might reflect computational constraints or model limitations at larger k. Further investigation into the methods’ architectures or data handling strategies could clarify these trends.