## Line Charts: Q-Projection α vs Relative Depth (i/L)
### Overview
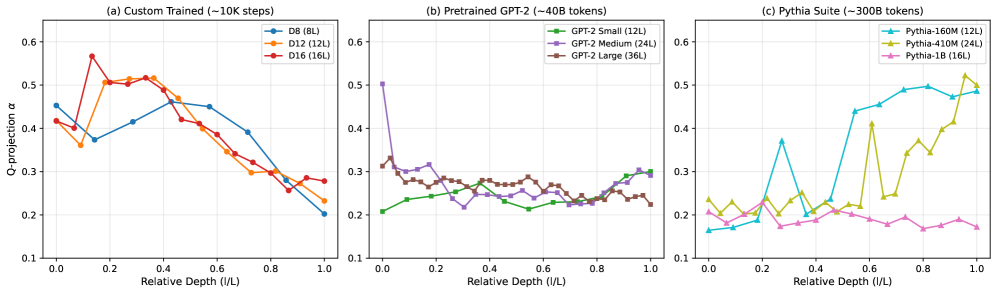
Three line charts compare Q-projection α values across relative depth (i/L) for different model configurations. Each chart represents distinct training paradigms: custom training, pretrained GPT-2, and Pythia Suite.
### Components/Axes
- **X-axis**: Relative Depth (i/L) from 0.0 to 1.0 in increments of 0.2.
- **Y-axis**: Q-projection α ranging from 0.1 to 0.6.
- **Legends**:
- **(a) Custom Trained**: DB (BL) [blue], D12 (12L) [orange], D16 (16L) [red].
- **(b) Pretrained GPT-2**: GPT-2 Small (12L) [green], GPT-2 Medium (24L) [purple], GPT-2 Large (36L) [brown].
- **(c) Pythia Suite**: Pythia-160M (12L) [blue], Pythia-410M (24L) [yellow], Pythia-1B (16L) [pink].
### Detailed Analysis
#### (a) Custom Trained (~10K steps)
- **DB (BL)**: Starts at ~0.45, peaks at ~0.55 (i/L=0.2), then declines to ~0.2 by i/L=1.0.
- **D12 (12L)**: Begins at ~0.35, rises to ~0.52 (i/L=0.2), dips to ~0.3 at i/L=0.6, and stabilizes near ~0.25.
- **D16 (16L)**: Sharp peak at ~0.58 (i/L=0.1), drops to ~0.3 by i/L=0.4, then fluctuates between ~0.25–0.3.
#### (b) Pretrained GPT-2 (~40B tokens)
- **GPT-2 Small (12L)**: Starts at ~0.2, rises to ~0.25 (i/L=0.2), dips to ~0.22 (i/L=0.4), and stabilizes near ~0.25.
- **GPT-2 Medium (24L)**: Peaks at ~0.5 (i/L=0.0), plunges to ~0.22 (i/L=0.2), then fluctuates between ~0.25–0.3.
- **GPT-2 Large (36L)**: Starts at ~0.3, dips to ~0.25 (i/L=0.2), rises to ~0.28 (i/L=0.4), and stabilizes near ~0.25.
#### (c) Pythia Suite (~300B tokens)
- **Pythia-160M (12L)**: Begins at ~0.15, spikes to ~0.38 (i/L=0.4), dips to ~0.2 (i/L=0.6), then rises to ~0.48 (i/L=1.0).
- **Pythia-410M (24L)**: Starts at ~0.22, peaks at ~0.42 (i/L=0.6), dips to ~0.25 (i/L=0.8), and rises to ~0.5 (i/L=1.0).
- **Pythia-1B (16L)**: Starts at ~0.2, fluctuates between ~0.18–0.22, with minor peaks at i/L=0.2 and 0.6.
### Key Observations
1. **Model Size vs. Performance**: Larger models (e.g., D16, GPT-2 Large, Pythia-410M) generally exhibit higher Q-projection α values but show greater variability.
2. **Early Depth Dominance**: Most models peak at lower relative depths (i/L=0.2–0.4), suggesting stronger initial Q-projection capabilities.
3. **Stability vs. Volatility**: Smaller models (e.g., GPT-2 Small, Pythia-1B) show smoother trends, while larger models exhibit sharper fluctuations.
4. **Pythia-160M Anomaly**: The sharp peak at i/L=0.4 (~0.38) contrasts with its gradual rise to ~0.48 at i/L=1.0, indicating a potential inflection point.
### Interpretation
- **Custom Training (a)**: The D16 (16L) model’s early peak may reflect optimized initialization for shallow depths, while its decline suggests diminishing returns at greater depths.
- **Pretrained GPT-2 (b)**: The Medium model’s drastic drop at i/L=0.2 hints at architectural limitations in deeper layers despite its large size.
- **Pythia Suite (c)**: The Pythia-410M (24L) model’s late-stage rise (i/L=1.0) implies improved Q-projection in deeper layers, possibly due to advanced tokenization or layer interactions.
- **General Trend**: Q-projection α correlates with model capacity, but deeper layers often underperform relative to shallower ones, except in Pythia-410M.
*Note: All values are approximate, derived from visual inspection of the plotted lines.*