## Flowchart: AI Interpretability Implementation Process
### Overview
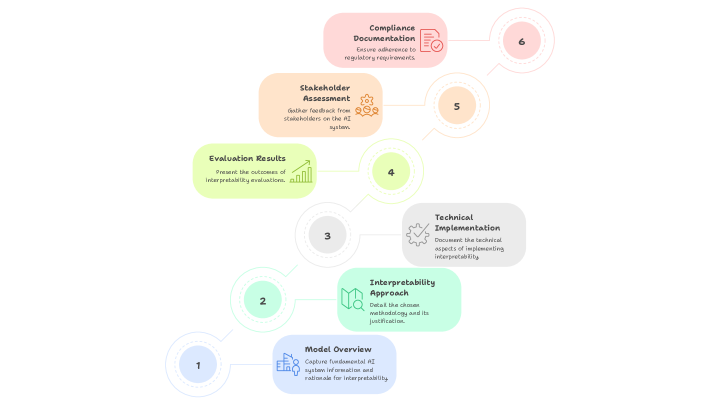
The flowchart illustrates a six-step process for implementing AI interpretability, progressing sequentially from top to bottom. Each step is color-coded and connected by arrows, emphasizing a structured workflow from foundational analysis to compliance documentation.
### Components/Axes
- **Steps**: Six labeled stages (1–6) with distinct colors and icons.
- **Flow Direction**: Top-to-bottom progression, with each step connected to the next via arrows.
- **Textual Content**: Each step includes a bolded title and descriptive text.
### Detailed Analysis
1. **Model Overview** (Light Blue)
- **Content**: "Capture fundamental AI system information and rationale for interpretability."
- **Icon**: Silhouette of a person with a building.
2. **Interpretable Approach** (Light Green)
- **Content**: "Detail the chosen methodology, its underlying principles, and its justification."
- **Icon**: Flowchart symbol.
3. **Technical Implementation** (Gray)
- **Content**: "Document the technical aspects of implementing interpretability."
- **Icon**: Gear.
4. **Evaluation Results** (Light Yellow)
- **Content**: "Present the outcomes of interpretability evaluations."
- **Icon**: Bar chart.
5. **Stakeholder Assessment** (Light Orange)
- **Content**: "Gather feedback from stakeholders on the AI system."
- **Icon**: Person with a speech bubble.
6. **Compliance Documentation** (Light Pink)
- **Content**: "Ensure alignment with regulatory requirements."
- **Icon**: Checkmark.
### Key Observations
- **Sequential Dependency**: Each step is prerequisites for the next, forming a linear workflow.
- **Focus Areas**: The process emphasizes technical rigor (Steps 3–4), stakeholder engagement (Step 5), and regulatory alignment (Step 6).
- **No Numerical Data**: The flowchart lacks quantitative metrics, focusing instead on qualitative stages.
### Interpretation
This flowchart outlines a systematic approach to AI interpretability, prioritizing transparency at every stage. The inclusion of stakeholder feedback (Step 5) and compliance (Step 6) suggests an emphasis on ethical and regulatory accountability. The absence of numerical data implies the process is designed for qualitative evaluation, likely adaptable to diverse AI systems. The progression from technical implementation to evaluation highlights a feedback loop, though the diagram does not explicitly show iterative refinement. The use of distinct icons and colors aids in distinguishing phases, though a legend is missing to clarify color coding.