# Technical Document: Compute Optimal Search Analysis
## Chart Description
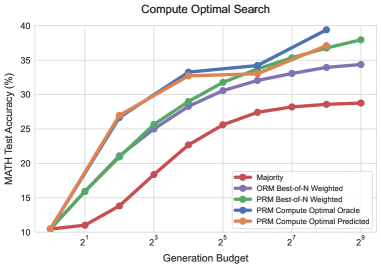
The image is a **line chart** titled **"Compute Optimal Search"**, visualizing the relationship between **Generation Budget** (x-axis) and **MATH Test Accuracy (%)** (y-axis). The chart compares five distinct algorithms across increasing computational budgets.
---
### Axis Details
- **X-Axis (Generation Budget)**:
- Logarithmic scale with markers at `2^1`, `2^3`, `2^5`, `2^7`, `2^9`.
- Labels: `2^1`, `2^3`, `2^5`, `2^7`, `2^9`.
- **Y-Axis (MATH Test Accuracy %)**:
- Linear scale from `10%` to `40%` in increments of `5%`.
- Labels: `10%`, `15%`, `20%`, `25%`, `30%`, `35%`, `40%`.
---
### Legend
- **Location**: Bottom-right corner.
- **Labels and Colors**:
1. **Majority** (Red)
2. **ORM Best-of-N Weighted** (Purple)
3. **PRM Best-of-N Weighted** (Green)
4. **PRM Compute Optimal Oracle** (Blue)
5. **PRM Compute Optimal Predicted** (Orange)
---
### Data Series and Trends
#### 1. **Majority (Red Line)**
- **Trend**: Gradual upward slope.
- **Key Points**:
- `2^1`: `10.0%`
- `2^3`: `18.0%`
- `2^5`: `22.5%`
- `2^7`: `27.8%`
- `2^9`: `28.5%`
#### 2. **ORM Best-of-N Weighted (Purple Line)**
- **Trend**: Steeper upward slope than "Majority".
- **Key Points**:
- `2^1`: `10.0%`
- `2^3`: `24.5%`
- `2^5`: `30.2%`
- `2^7`: `32.8%`
- `2^9`: `34.2%`
#### 3. **PRM Best-of-N Weighted (Green Line)**
- **Trend**: Steeper than "ORM", with consistent growth.
- **Key Points**:
- `2^1`: `10.0%`
- `2^3`: `25.5%`
- `2^5`: `31.8%`
- `2^7`: `35.3%`
- `2^9`: `37.8%`
#### 4. **PRM Compute Optimal Oracle (Blue Line)**
- **Trend**: Sharpest upward trajectory, reaching the highest accuracy.
- **Key Points**:
- `2^1`: `10.0%`
- `2^3`: `32.0%`
- `2^5`: `33.5%`
- `2^7`: `36.8%`
- `2^9`: `39.5%`
#### 5. **PRM Compute Optimal Predicted (Orange Line)**
- **Trend**: Moderate upward slope, plateauing near `2^7`.
- **Key Points**:
- `2^1`: `10.0%`
- `2^3`: `27.0%`
- `2^5`: `32.5%`
- `2^7`: `35.0%`
- `2^9`: `37.0%`
---
### Cross-Reference Verification
- **Legend Colors**: All line colors match their corresponding labels in the legend.
- **Spatial Grounding**:
- Legend is positioned in the **bottom-right** corner, outside the plot area.
- Data points align with their respective lines and axes.
---
### Summary of Key Trends
1. **PRM Compute Optimal Oracle (Blue)** achieves the highest accuracy, surpassing all other methods at `2^9` (`39.5%`).
2. **PRM Best-of-N Weighted (Green)** and **PRM Compute Optimal Predicted (Orange)** show similar performance, with slight differences in growth rates.
3. **ORM Best-of-N Weighted (Purple)** and **Majority (Red)** exhibit slower growth, with "Majority" having the lowest final accuracy (`28.5%`).
---
### Notes
- All lines originate at `(2^1, 10.0%)`, indicating a baseline accuracy of `10%` for all algorithms at the minimum budget.
- No textual data tables or non-English content are present.
- The chart emphasizes computational efficiency, with higher budgets enabling better performance for most algorithms.