\n
## Horizontal Bar Chart: Answer Confidence Score (debate queries)
### Overview
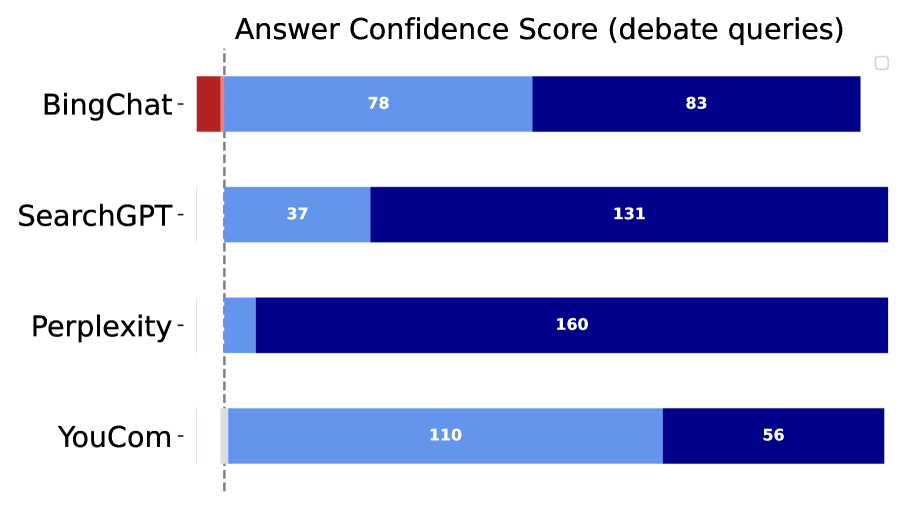
The image presents a horizontal bar chart comparing the "Answer Confidence Score" of four different AI models: BingChat, SearchGPT, Perplexity, and YouCom, when responding to "debate queries". The scores are represented by the length of the bars, with each bar segmented into two sections of different shades of blue. Numerical values are displayed within each bar segment.
### Components/Axes
* **Title:** "Answer Confidence Score (debate queries)" - positioned at the top-center of the chart.
* **Y-axis:** Represents the AI models: BingChat, SearchGPT, Perplexity, and YouCom. Labels are positioned on the left side of the chart.
* **X-axis:** Represents the "Answer Confidence Score". There is no explicit scale, but the values indicate the score range.
* **Bars:** Horizontal bars representing each AI model's confidence score. Each bar is divided into two sections with different shades of blue.
* **Data Labels:** Numerical values displayed within each bar segment, indicating the score for that segment.
### Detailed Analysis
The chart displays the following data:
* **BingChat:** The bar is segmented into two parts. The first segment (light blue) has a value of approximately 78. The second segment (dark blue) has a value of approximately 83. The total bar length represents a combined score of 78 + 83 = 161.
* **SearchGPT:** The bar is segmented into two parts. The first segment (light blue) has a value of approximately 37. The second segment (dark blue) has a value of approximately 131. The total bar length represents a combined score of 37 + 131 = 168.
* **Perplexity:** The bar is segmented into two parts. The first segment (light blue) has a value of approximately 160. The second segment (dark blue) has a value of 0 (not explicitly shown, but the bar is a single color). The total bar length represents a combined score of 160 + 0 = 160.
* **YouCom:** The bar is segmented into two parts. The first segment (light blue) has a value of approximately 110. The second segment (dark blue) has a value of approximately 56. The total bar length represents a combined score of 110 + 56 = 166.
### Key Observations
* Perplexity has the highest single-segment score (160).
* SearchGPT has the highest dark blue segment score (131).
* BingChat has the lowest overall score (161).
* The light blue segments vary significantly across the models, while the dark blue segments are more consistent.
### Interpretation
The chart suggests that the AI models exhibit varying levels of confidence when answering debate queries. The segmentation of the bars into two colors could represent different aspects of confidence, such as initial confidence versus confidence after further processing or reasoning. Perplexity appears to have a strong initial confidence (high light blue segment), while SearchGPT demonstrates a significant increase in confidence through subsequent processing (high dark blue segment). BingChat consistently shows lower confidence scores compared to the other models. The data implies that the models employ different strategies for handling debate-related questions, leading to variations in their confidence levels. The lack of a defined scale on the x-axis makes it difficult to assess the absolute meaning of the confidence scores, but the relative differences between the models are clearly visible.