## Line Chart: 1-day Accuracy vs. Search Time for Various NAS Methods
### Overview
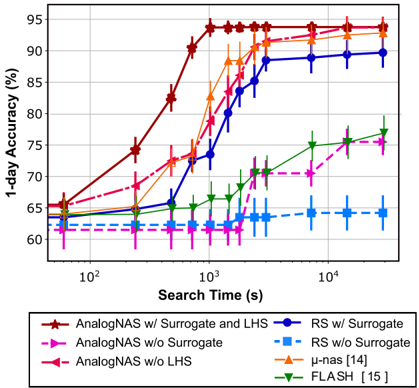
This image is a line chart comparing the performance of seven different Neural Architecture Search (NAS) methods. The chart plots "1-day Accuracy (%)" on the Y-axis against "Search Time (s)" on a logarithmic X-axis. The chart includes error bars for each data point, indicating variance or uncertainty in the measurements.
### Components/Axes
* **Y-Axis:** Labeled "1-day Accuracy (%)". The scale ranges from 55 to 95, with major grid lines at 5-unit intervals.
* **X-Axis:** Labeled "Search Time (s)". This is a logarithmic scale ranging from $10^2$ to $10^4$ seconds.
* **Legend:** Located at the bottom of the chart, containing seven entries corresponding to the plotted lines.
* **AnalogNAS w/ Surrogate and LHS:** Dark Red, Solid line, Star marker.
* **AnalogNAS w/o Surrogate:** Magenta, Dashed line, Right-pointing triangle marker.
* **AnalogNAS w/o LHS:** Dark Red, Dash-dot line, Left-pointing triangle marker.
* **RS w/ Surrogate:** Blue, Solid line, Circle marker.
* **RS w/o Surrogate:** Light Blue, Dashed line, Square marker.
* **μ-nas [14]:** Orange, Solid line, Upward triangle marker.
* **FLASH [15]:** Green, Solid line, Downward triangle marker.
### Detailed Analysis
The chart displays the following trends and data points:
* **AnalogNAS w/ Surrogate and LHS (Dark Red, Solid, Star):** This series shows the fastest convergence. It starts at ~65% accuracy at $10^2$s, rises sharply between $5 \times 10^2$s and $10^3$s, and plateaus at ~94% accuracy from $10^3$s onwards.
* **AnalogNAS w/o LHS (Dark Red, Dash-dot, Left-Triangle):** This series follows a similar trajectory to the "w/ Surrogate and LHS" model but is slightly slower to converge. It reaches ~94% accuracy around $2 \times 10^3$s.
* **μ-nas [14] (Orange, Solid, Up-Triangle):** This series shows a sharp increase between $5 \times 10^2$s and $2 \times 10^3$s, eventually plateauing at ~93% accuracy around $3 \times 10^3$s.
* **RS w/ Surrogate (Blue, Solid, Circle):** This series shows a more gradual increase compared to the AnalogNAS variants. It rises steadily between $5 \times 10^2$s and $3 \times 10^3$s, plateauing at ~90% accuracy from $3 \times 10^3$s onwards.
* **FLASH [15] (Green, Solid, Down-Triangle):** This series shows a slow, steady increase throughout the entire search time, starting at ~64% and reaching ~77% at the end of the time range ($3 \times 10^4$s).
* **AnalogNAS w/o Surrogate (Magenta, Dashed, Right-Triangle):** This series shows a moderate increase, reaching ~70% at $2 \times 10^3$s, and then plateaus at ~75% from $10^4$s onwards.
* **RS w/o Surrogate (Light Blue, Dashed, Square):** This series is essentially flat. It starts at ~62% and remains constant at ~64% throughout the entire search time, indicating no significant improvement with increased search time.
### Key Observations
* **Efficiency:** The "AnalogNAS w/ Surrogate and LHS" method is the most efficient, achieving the highest accuracy in the shortest amount of time.
* **Impact of Surrogates:** Comparing "RS w/ Surrogate" (Blue) vs. "RS w/o Surrogate" (Light Blue) and "AnalogNAS w/ Surrogate" vs. "AnalogNAS w/o Surrogate" (Magenta) clearly demonstrates that the use of a surrogate model is a critical factor for achieving high accuracy in this search space.
* **Diminishing Returns:** Most methods (except FLASH) show a clear plateau effect, where increasing search time beyond $3 \times 10^3$ seconds yields negligible improvements in accuracy.
* **LHS Impact:** The difference between "AnalogNAS w/ LHS" and "AnalogNAS w/o LHS" is minimal, suggesting that while LHS (Latin Hypercube Sampling) is beneficial, it is not the primary driver of the performance gains seen in the AnalogNAS framework.
### Interpretation
The data demonstrates that the AnalogNAS framework, particularly when combined with a surrogate model, significantly outperforms standard Random Search (RS) and the referenced baseline methods (μ-nas and FLASH) in terms of both convergence speed and final accuracy. The "w/o Surrogate" variants perform poorly, confirming that surrogate-assisted search is essential for navigating this architecture space efficiently. The plateauing behavior across most methods suggests that the search space is effectively explored within the first few thousand seconds, and further computation provides little benefit.