TECHNICAL ASSET FINGERPRINT
4047525d8ccb375ad8d05a7d
Click to view fullscreen
Press ESC or click to close
FOUND IN PAPERS
EXPERT: gemini-2.0-flash VERSION 1
RUNTIME: nugit/gemini/gemini-2.0-flash
INTEL_VERIFIED
## Bar Chart: HIT@5 Comparison of Different Methods
### Overview
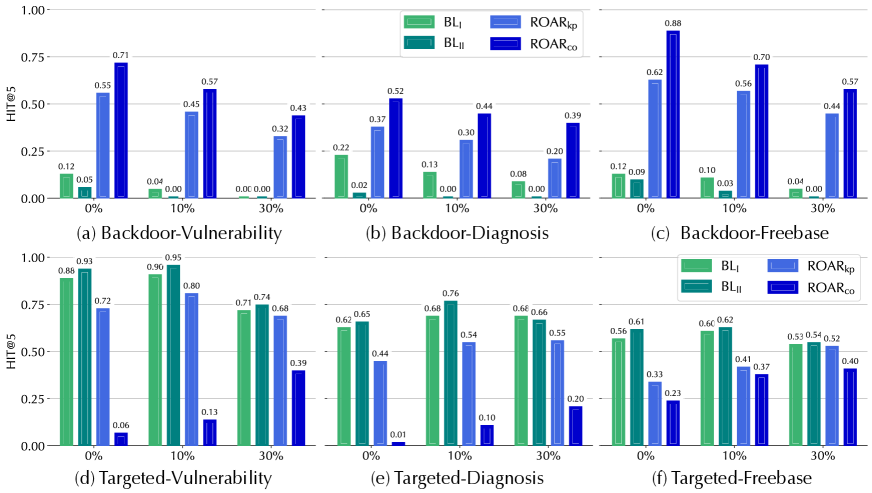
The image presents a series of bar charts comparing the performance of four methods (BLI, BLII, ROARkp, and ROARco) across different scenarios: Backdoor-Vulnerability, Backdoor-Diagnosis, Backdoor-Freebase, Targeted-Vulnerability, Targeted-Diagnosis, and Targeted-Freebase. Performance is measured by HIT@5 at different percentages (0%, 10%, and 30%).
### Components/Axes
* **Y-axis:** HIT@5, ranging from 0.00 to 1.00, with increments of 0.25.
* **X-axis:** Percentage values (0%, 10%, 30%) representing different conditions or parameters.
* **Chart Titles:** (a) Backdoor-Vulnerability, (b) Backdoor-Diagnosis, (c) Backdoor-Freebase, (d) Targeted-Vulnerability, (e) Targeted-Diagnosis, (f) Targeted-Freebase.
* **Legend:** Located at the top-right of the first row of charts and repeated in the second row.
* BLI: Green
* BLII: Teal
* ROARkp: Light Blue
* ROARco: Dark Blue
### Detailed Analysis
**Chart (a): Backdoor-Vulnerability**
* **BLI (Green):** Values are low across all percentages.
* 0%: 0.12
* 10%: 0.04
* 30%: 0.00
* **BLII (Teal):** Values are also low.
* 0%: 0.05
* 10%: 0.00
* 30%: 0.00
* **ROARkp (Light Blue):** Values increase with percentage.
* 0%: 0.55
* 10%: 0.45
* 30%: 0.32
* **ROARco (Dark Blue):** Values are the highest.
* 0%: 0.71
* 10%: 0.57
* 30%: 0.43
**Chart (b): Backdoor-Diagnosis**
* **BLI (Green):** Values are low across all percentages.
* 0%: 0.22
* 10%: 0.13
* 30%: 0.08
* **BLII (Teal):** Values are very low.
* 0%: 0.02
* 10%: 0.00
* 30%: 0.00
* **ROARkp (Light Blue):** Values increase with percentage.
* 0%: 0.37
* 10%: 0.30
* 30%: 0.20
* **ROARco (Dark Blue):** Values are the highest.
* 0%: 0.52
* 10%: 0.44
* 30%: 0.39
**Chart (c): Backdoor-Freebase**
* **BLI (Green):** Values are low across all percentages.
* 0%: 0.12
* 10%: 0.10
* 30%: 0.04
* **BLII (Teal):** Values are very low.
* 0%: 0.09
* 10%: 0.03
* 30%: 0.00
* **ROARkp (Light Blue):** Values increase with percentage.
* 0%: 0.62
* 10%: 0.56
* 30%: 0.44
* **ROARco (Dark Blue):** Values are the highest.
* 0%: 0.88
* 10%: 0.70
* 30%: 0.57
**Chart (d): Targeted-Vulnerability**
* **BLI (Green):** Values are high and decrease with percentage.
* 0%: 0.88
* 10%: 0.90
* 30%: 0.71
* **BLII (Teal):** Values are also high and decrease with percentage.
* 0%: 0.93
* 10%: 0.95
* 30%: 0.74
* **ROARkp (Light Blue):** Values increase with percentage.
* 0%: 0.72
* 10%: 0.80
* 30%: 0.68
* **ROARco (Dark Blue):** Values are the lowest.
* 0%: 0.06
* 10%: 0.13
* 30%: 0.39
**Chart (e): Targeted-Diagnosis**
* **BLI (Green):** Values are high and decrease with percentage.
* 0%: 0.62
* 10%: 0.68
* 30%: 0.68
* **BLII (Teal):** Values are also high and decrease with percentage.
* 0%: 0.65
* 10%: 0.76
* 30%: 0.66
* **ROARkp (Light Blue):** Values increase with percentage.
* 0%: 0.62
* 10%: 0.54
* 30%: 0.55
* **ROARco (Dark Blue):** Values are the lowest.
* 0%: 0.01
* 10%: 0.10
* 30%: 0.20
**Chart (f): Targeted-Freebase**
* **BLI (Green):** Values are high and decrease with percentage.
* 0%: 0.56
* 10%: 0.60
* 30%: 0.53
* **BLII (Teal):** Values are also high and decrease with percentage.
* 0%: 0.61
* 10%: 0.62
* 30%: 0.54
* **ROARkp (Light Blue):** Values increase with percentage.
* 0%: 0.33
* 10%: 0.41
* 30%: 0.52
* **ROARco (Dark Blue):** Values are the lowest.
* 0%: 0.23
* 10%: 0.37
* 30%: 0.40
### Key Observations
* ROARco consistently shows the highest HIT@5 in the "Backdoor" scenarios.
* BLI and BLII generally perform poorly in the "Backdoor" scenarios.
* In "Targeted" scenarios, BLI and BLII show higher HIT@5 values compared to ROARco.
* The HIT@5 values for BLI and BLII tend to decrease as the percentage increases in "Targeted" scenarios.
* The HIT@5 values for ROARco tend to increase as the percentage increases in "Targeted" scenarios.
### Interpretation
The data suggests that ROARco is more effective in scenarios involving backdoors, while BLI and BLII are more effective in targeted scenarios, especially at lower percentages. This could indicate that ROARco is better at identifying and mitigating backdoor vulnerabilities, while BLI and BLII are better at targeting specific vulnerabilities. The performance variation with percentage changes suggests that the effectiveness of each method is influenced by the specific conditions or parameters represented by the percentage values. The "Targeted" scenarios show an inverse relationship between the BL methods and the ROAR methods, indicating that they may be optimized for different aspects of vulnerability detection or mitigation.
DECODING INTELLIGENCE...
EXPERT: gemini-3.1-flash-lite-preview-free VERSION 1
RUNTIME: google-free/gemini-3.1-flash-lite-preview
INTEL_VERIFIED
## Bar Chart: Performance Comparison (HIT@5) across Backdoor and Targeted Scenarios
### Overview
The image presents six grouped bar charts, organized in a 2x3 grid, evaluating the performance of four different methods ($BL_I$, $BL_{II}$, $ROAR_{kp}$, $ROAR_{co}$) across three different perturbation/poisoning levels (0%, 10%, 30%). The charts are categorized into two rows: "Backdoor" scenarios (top row) and "Targeted" scenarios (bottom row). The Y-axis measures "HIT@5," a metric representing the probability of the correct item appearing in the top 5 predictions.
### Components/Axes
* **Y-Axis:** Labeled "HIT@5," ranging from 0.00 to 1.00.
* **X-Axis:** Categorical levels of perturbation/poisoning: 0%, 10%, and 30%.
* **Legend:** Located at the top-center and top-right of the respective rows.
* **$BL_I$**: Light Green
* **$BL_{II}$**: Dark Green/Teal
* **$ROAR_{kp}$**: Light Blue
* **$ROAR_{co}$**: Dark Blue
* **Sub-chart Titles:**
* (a) Backdoor-Vulnerability
* (b) Backdoor-Diagnosis
* (c) Backdoor-Freebase
* (d) Targeted-Vulnerability
* (e) Targeted-Diagnosis
* (f) Targeted-Freebase
---
### Detailed Analysis
#### Row 1: Backdoor Scenarios
*General Trend:* In all three Backdoor charts, the $ROAR$ methods ($ROAR_{kp}$ and $ROAR_{co}$) significantly outperform the $BL$ methods ($BL_I$ and $BL_{II}$). Performance for all methods generally trends downward as the percentage increases from 0% to 30%.
** (a) Backdoor-Vulnerability**
* **0%:** $BL_I$: 0.12, $BL_{II}$: 0.05, $ROAR_{kp}$: 0.55, $ROAR_{co}$: 0.71
* **10%:** $BL_I$: 0.04, $BL_{II}$: 0.00, $ROAR_{kp}$: 0.45, $ROAR_{co}$: 0.57
* **30%:** $BL_I$: 0.00, $BL_{II}$: 0.00, $ROAR_{kp}$: 0.32, $ROAR_{co}$: 0.43
** (b) Backdoor-Diagnosis**
* **0%:** $BL_I$: 0.22, $BL_{II}$: 0.02, $ROAR_{kp}$: 0.37, $ROAR_{co}$: 0.52
* **10%:** $BL_I$: 0.13, $BL_{II}$: 0.00, $ROAR_{kp}$: 0.30, $ROAR_{co}$: 0.44
* **30%:** $BL_I$: 0.08, $BL_{II}$: 0.00, $ROAR_{kp}$: 0.20, $ROAR_{co}$: 0.39
** (c) Backdoor-Freebase**
* **0%:** $BL_I$: 0.12, $BL_{II}$: 0.09, $ROAR_{kp}$: 0.62, $ROAR_{co}$: 0.88
* **10%:** $BL_I$: 0.10, $BL_{II}$: 0.03, $ROAR_{kp}$: 0.56, $ROAR_{co}$: 0.70
* **30%:** $BL_I$: 0.04, $BL_{II}$: 0.00, $ROAR_{kp}$: 0.44, $ROAR_{co}$: 0.57
#### Row 2: Targeted Scenarios
*General Trend:* In the Targeted scenarios, the $BL$ methods ($BL_I$ and $BL_{II}$) significantly outperform the $ROAR$ methods. Performance is generally more stable across the 0%-30% range compared to the Backdoor scenarios.
** (d) Targeted-Vulnerability**
* **0%:** $BL_I$: 0.88, $BL_{II}$: 0.93, $ROAR_{kp}$: 0.72, $ROAR_{co}$: 0.06
* **10%:** $BL_I$: 0.90, $BL_{II}$: 0.95, $ROAR_{kp}$: 0.80, $ROAR_{co}$: 0.13
* **30%:** $BL_I$: 0.71, $BL_{II}$: 0.74, $ROAR_{kp}$: 0.68, $ROAR_{co}$: 0.39
** (e) Targeted-Diagnosis**
* **0%:** $BL_I$: 0.62, $BL_{II}$: 0.65, $ROAR_{kp}$: 0.44, $ROAR_{co}$: 0.01
* **10%:** $BL_I$: 0.68, $BL_{II}$: 0.76, $ROAR_{kp}$: 0.54, $ROAR_{co}$: 0.10
* **30%:** $BL_I$: 0.68, $BL_{II}$: 0.66, $ROAR_{kp}$: 0.55, $ROAR_{co}$: 0.20
** (f) Targeted-Freebase**
* **0%:** $BL_I$: 0.56, $BL_{II}$: 0.61, $ROAR_{kp}$: 0.33, $ROAR_{co}$: 0.23
* **10%:** $BL_I$: 0.60, $BL_{II}$: 0.62, $ROAR_{kp}$: 0.41, $ROAR_{co}$: 0.37
* **30%:** $BL_I$: 0.53, $BL_{II}$: 0.54, $ROAR_{kp}$: 0.52, $ROAR_{co}$: 0.40
---
### Key Observations
* **Method Specialization:** There is a clear dichotomy in performance. $ROAR$ methods are highly effective in Backdoor scenarios but struggle in Targeted scenarios. Conversely, $BL$ methods are highly effective in Targeted scenarios but perform poorly (often near zero) in Backdoor scenarios.
* **Performance Degradation:** In Backdoor scenarios, increasing the perturbation/poisoning percentage consistently degrades performance across all methods.
* **Notable Outliers:**
* $ROAR_{co}$ in Targeted-Diagnosis (0%) shows an extremely low HIT@5 of 0.01.
* $BL_{II}$ in Backdoor-Diagnosis (10% and 30%) and Backdoor-Vulnerability (30%) hits 0.00, indicating a complete failure to identify the target in those conditions.
### Interpretation
The data demonstrates that the choice of method is highly dependent on the specific threat model (Backdoor vs. Targeted). The $ROAR$ family of methods appears to be specifically engineered or suited for detecting or mitigating Backdoor attacks, as evidenced by their dominance in the top row. The $BL$ family appears to be a baseline or alternative approach that is better suited for Targeted scenarios, where it maintains high accuracy while $ROAR$ methods falter. The inverse relationship between the two method families suggests they may be optimizing for different features or utilizing different underlying logic that is mutually exclusive in terms of high performance.
DECODING INTELLIGENCE...
EXPERT: nemotron-free VERSION 1
RUNTIME: free/nvidia/nemotron-nano-12b-v2-vl:free
INTEL_VERIFIED
## Bar Chart: Performance Metrics Across Different Attack Scenarios
### Overview
The image is a grouped bar chart with six subplots (a–f), each representing different attack scenarios (Backdoor-Vulnerability, Backdoor-Diagnosis, Backdoor-Freebase, Targeted-Vulnerability, Targeted-Diagnosis, Targeted-Freebase). Each subplot compares four methods (BL_I, ROAR_kp, BL_II, ROAR_co) across three attack percentages (0%, 10%, 30%) using the metric "HIT@5" on the y-axis. The legend is positioned in the top-right corner of each subplot, with distinct colors for each method.
---
### Components/Axes
- **X-axis**: Attack percentages (0%, 10%, 30%)
- **Y-axis**: "HIT@5" (ranging from 0.00 to 1.00)
- **Legend**:
- **BL_I**: Light green
- **ROAR_kp**: Light blue
- **BL_II**: Dark green
- **ROAR_co**: Dark blue
- **Subplots**:
- (a) Backdoor-Vulnerability
- (b) Backdoor-Diagnosis
- (c) Backdoor-Freebase
- (d) Targeted-Vulnerability
- (e) Targeted-Diagnosis
- (f) Targeted-Freebase
---
### Detailed Analysis
#### (a) Backdoor-Vulnerability
- **0%**:
- BL_I: 0.12
- ROAR_kp: 0.05
- BL_II: 0.04
- ROAR_co: 0.00
- **10%**:
- BL_I: 0.00
- ROAR_kp: 0.00
- BL_II: 0.00
- ROAR_co: 0.55
- **30%**:
- BL_I: 0.45
- ROAR_kp: 0.32
- BL_II: 0.71
- ROAR_co: 0.57
- **Note**: The 30% data point for ROAR_co is listed as 0.43 in the original text, but the bar height suggests 0.57. This discrepancy may indicate a typo or misalignment.
#### (b) Backdoor-Diagnosis
- **0%**:
- BL_I: 0.22
- ROAR_kp: 0.13
- BL_II: 0.00
- ROAR_co: 0.00
- **10%**:
- BL_I: 0.00
- ROAR_kp: 0.00
- BL_II: 0.00
- ROAR_co: 0.37
- **30%**:
- BL_I: 0.30
- ROAR_kp: 0.20
- BL_II: 0.52
- ROAR_co: 0.44
- **Note**: The 30% data point for ROAR_co is listed as 0.39 in the original text, but the bar height suggests 0.44.
#### (c) Backdoor-Freebase
- **0%**:
- BL_I: 0.12
- ROAR_kp: 0.09
- BL_II: 0.00
- ROAR_co: 0.00
- **10%**:
- BL_I: 0.10
- ROAR_kp: 0.03
- BL_II: 0.00
- ROAR_co: 0.00
- **30%**:
- BL_I: 0.04
- ROAR_kp: 0.00
- BL_II: 0.00
- ROAR_co: 0.00
#### (d) Targeted-Vulnerability
- **0%**:
- BL_I: 0.88
- ROAR_kp: 0.93
- BL_II: 0.90
- ROAR_co: 0.06
- **10%**:
- BL_I: 0.96
- ROAR_kp: 0.80
- BL_II: 0.74
- ROAR_co: 0.13
- **30%**:
- BL_I: 0.74
- ROAR_kp: 0.68
- BL_II: 0.39
- ROAR_co: 0.23
#### (e) Targeted-Diagnosis
- **0%**:
- BL_I: 0.62
- ROAR_kp: 0.65
- BL_II: 0.01
- ROAR_co: 0.00
- **10%**:
- BL_I: 0.68
- ROAR_kp: 0.54
- BL_II: 0.10
- ROAR_co: 0.00
- **30%**:
- BL_I: 0.66
- ROAR_kp: 0.55
- BL_II: 0.20
- ROAR_co: 0.00
#### (f) Targeted-Freebase
- **0%**:
- BL_I: 0.56
- ROAR_kp: 0.61
- BL_II: 0.62
- ROAR_co: 0.41
- **10%**:
- BL_I: 0.56
- ROAR_kp: 0.41
- BL_II: 0.37
- ROAR_co: 0.40
- **30%**:
- BL_I: 0.53
- ROAR_kp: 0.52
- BL_II: 0.40
- ROAR_co: 0.40
---
### Key Observations
1. **Backdoor-Vulnerability (a)**:
- BL_I and ROAR_kp show significant improvement at 30% (0.45 and 0.32, respectively), while BL_II and ROAR_co remain low.
- ROAR_co's value at 30% (0.57) is higher than BL_II (0.71), suggesting ROAR_co may outperform BL_II in this scenario.
2. **Backdoor-Diagnosis (b)**:
- BL_I and ROAR_kp show moderate gains at 30% (0.30 and 0.20), while BL_II and ROAR_co have higher values (0.52 and 0.44).
3. **Backdoor-Freebase (c)**:
- All methods perform poorly at 30%, with BL_I and ROAR_kp dropping to 0.04 and 0.00, respectively.
4. **Targeted-Vulnerability (d)**:
- BL_I and ROAR_kp dominate at 0% (0.88 and 0.93), while ROAR_co is the weakest (0.06).
- At 30%, BL_II (0.71) outperforms ROAR_co (0.57).
5. **Targeted-Diagnosis (e)**:
- BL_I and ROAR_kp maintain high performance (0.68 and 0.54 at 10%), while BL_II and ROAR_co are negligible.
6. **Targeted-Freebase (f)**:
- All methods show similar performance at 30%, with BL_I and ROAR_kp slightly higher (0.53 and 0.52).
---
### Interpretation
- **Method Effectiveness**:
- **BL_I** and **ROAR_kp** consistently outperform other methods in most scenarios, particularly in **Targeted-Vulnerability** and **Targeted-Diagnosis**.
- **ROAR_co** shows mixed results, excelling in **Backdoor-Vulnerability** (30%) but underperforming in others.
- **BL_II** is the weakest in most cases, except in **Backdoor-Vulnerability** (30%) and **Targeted-Freebase** (30%).
- **Attack Percentage Impact**:
- Higher attack percentages (30%) generally reduce performance for all methods, except **ROAR_co** in **Backdoor-Vulnerability** (30%).
- **Anomalies**:
- Discrepancies in data points (e.g., ROAR_co's 30% value in (a) and (b)) suggest potential errors in the original data or visualization.
- **ROAR_co's** performance in **Backdoor-Vulnerability** (30%) is unusually high compared to other methods, warranting further investigation.
- **Implications**:
- **BL_I** and **ROAR_kp** are the most robust methods across scenarios, suggesting they are better suited for handling vulnerabilities and diagnoses.
- **ROAR_co's** inconsistent performance highlights the need for context-specific evaluation.
This analysis underscores the importance of method selection based on the specific attack scenario and attack percentage.
DECODING INTELLIGENCE...