## Bar Chart: HIT@5 Comparison of Different Methods
### Overview
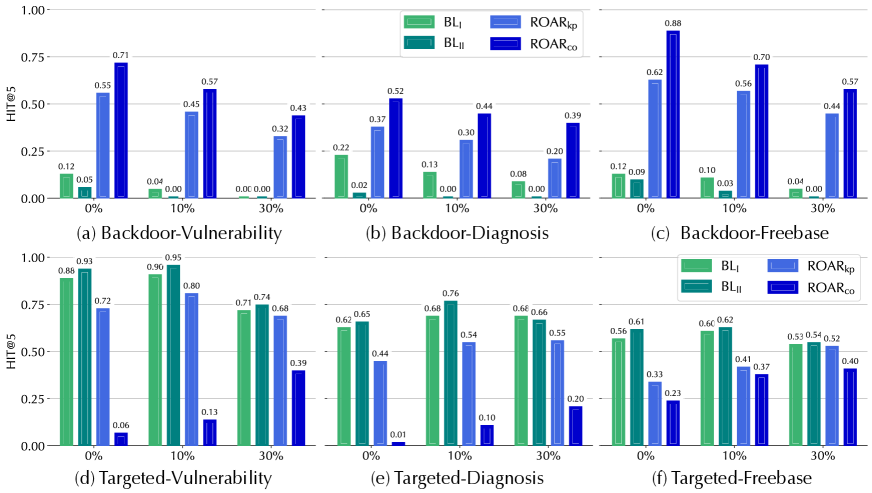
The image presents a series of bar charts comparing the performance of four methods (BLI, BLII, ROARkp, and ROARco) across different scenarios: Backdoor-Vulnerability, Backdoor-Diagnosis, Backdoor-Freebase, Targeted-Vulnerability, Targeted-Diagnosis, and Targeted-Freebase. Performance is measured by HIT@5 at different percentages (0%, 10%, and 30%).
### Components/Axes
* **Y-axis:** HIT@5, ranging from 0.00 to 1.00, with increments of 0.25.
* **X-axis:** Percentage values (0%, 10%, 30%) representing different conditions or parameters.
* **Chart Titles:** (a) Backdoor-Vulnerability, (b) Backdoor-Diagnosis, (c) Backdoor-Freebase, (d) Targeted-Vulnerability, (e) Targeted-Diagnosis, (f) Targeted-Freebase.
* **Legend:** Located at the top-right of the first row of charts and repeated in the second row.
* BLI: Green
* BLII: Teal
* ROARkp: Light Blue
* ROARco: Dark Blue
### Detailed Analysis
**Chart (a): Backdoor-Vulnerability**
* **BLI (Green):** Values are low across all percentages.
* 0%: 0.12
* 10%: 0.04
* 30%: 0.00
* **BLII (Teal):** Values are also low.
* 0%: 0.05
* 10%: 0.00
* 30%: 0.00
* **ROARkp (Light Blue):** Values increase with percentage.
* 0%: 0.55
* 10%: 0.45
* 30%: 0.32
* **ROARco (Dark Blue):** Values are the highest.
* 0%: 0.71
* 10%: 0.57
* 30%: 0.43
**Chart (b): Backdoor-Diagnosis**
* **BLI (Green):** Values are low across all percentages.
* 0%: 0.22
* 10%: 0.13
* 30%: 0.08
* **BLII (Teal):** Values are very low.
* 0%: 0.02
* 10%: 0.00
* 30%: 0.00
* **ROARkp (Light Blue):** Values increase with percentage.
* 0%: 0.37
* 10%: 0.30
* 30%: 0.20
* **ROARco (Dark Blue):** Values are the highest.
* 0%: 0.52
* 10%: 0.44
* 30%: 0.39
**Chart (c): Backdoor-Freebase**
* **BLI (Green):** Values are low across all percentages.
* 0%: 0.12
* 10%: 0.10
* 30%: 0.04
* **BLII (Teal):** Values are very low.
* 0%: 0.09
* 10%: 0.03
* 30%: 0.00
* **ROARkp (Light Blue):** Values increase with percentage.
* 0%: 0.62
* 10%: 0.56
* 30%: 0.44
* **ROARco (Dark Blue):** Values are the highest.
* 0%: 0.88
* 10%: 0.70
* 30%: 0.57
**Chart (d): Targeted-Vulnerability**
* **BLI (Green):** Values are high and decrease with percentage.
* 0%: 0.88
* 10%: 0.90
* 30%: 0.71
* **BLII (Teal):** Values are also high and decrease with percentage.
* 0%: 0.93
* 10%: 0.95
* 30%: 0.74
* **ROARkp (Light Blue):** Values increase with percentage.
* 0%: 0.72
* 10%: 0.80
* 30%: 0.68
* **ROARco (Dark Blue):** Values are the lowest.
* 0%: 0.06
* 10%: 0.13
* 30%: 0.39
**Chart (e): Targeted-Diagnosis**
* **BLI (Green):** Values are high and decrease with percentage.
* 0%: 0.62
* 10%: 0.68
* 30%: 0.68
* **BLII (Teal):** Values are also high and decrease with percentage.
* 0%: 0.65
* 10%: 0.76
* 30%: 0.66
* **ROARkp (Light Blue):** Values increase with percentage.
* 0%: 0.62
* 10%: 0.54
* 30%: 0.55
* **ROARco (Dark Blue):** Values are the lowest.
* 0%: 0.01
* 10%: 0.10
* 30%: 0.20
**Chart (f): Targeted-Freebase**
* **BLI (Green):** Values are high and decrease with percentage.
* 0%: 0.56
* 10%: 0.60
* 30%: 0.53
* **BLII (Teal):** Values are also high and decrease with percentage.
* 0%: 0.61
* 10%: 0.62
* 30%: 0.54
* **ROARkp (Light Blue):** Values increase with percentage.
* 0%: 0.33
* 10%: 0.41
* 30%: 0.52
* **ROARco (Dark Blue):** Values are the lowest.
* 0%: 0.23
* 10%: 0.37
* 30%: 0.40
### Key Observations
* ROARco consistently shows the highest HIT@5 in the "Backdoor" scenarios.
* BLI and BLII generally perform poorly in the "Backdoor" scenarios.
* In "Targeted" scenarios, BLI and BLII show higher HIT@5 values compared to ROARco.
* The HIT@5 values for BLI and BLII tend to decrease as the percentage increases in "Targeted" scenarios.
* The HIT@5 values for ROARco tend to increase as the percentage increases in "Targeted" scenarios.
### Interpretation
The data suggests that ROARco is more effective in scenarios involving backdoors, while BLI and BLII are more effective in targeted scenarios, especially at lower percentages. This could indicate that ROARco is better at identifying and mitigating backdoor vulnerabilities, while BLI and BLII are better at targeting specific vulnerabilities. The performance variation with percentage changes suggests that the effectiveness of each method is influenced by the specific conditions or parameters represented by the percentage values. The "Targeted" scenarios show an inverse relationship between the BL methods and the ROAR methods, indicating that they may be optimized for different aspects of vulnerability detection or mitigation.