## Bar Chart: Performance Comparison of Detection Methods
### Overview
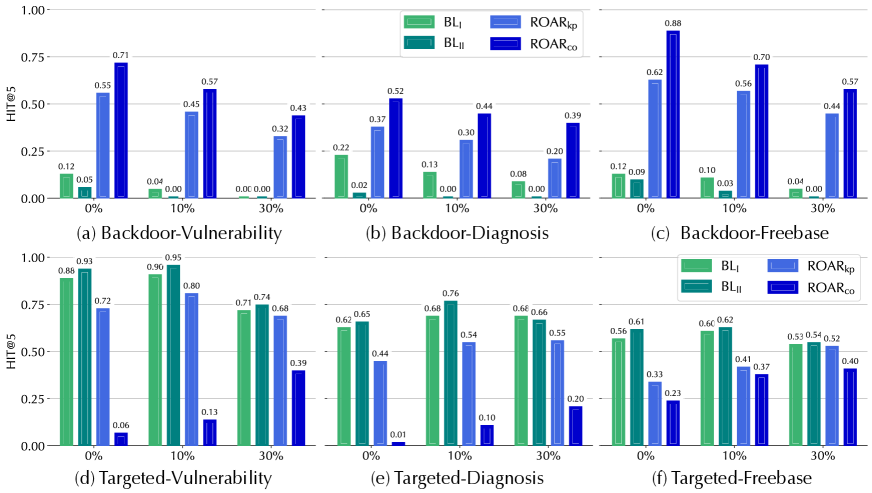
The image presents a series of six bar charts comparing the performance of different detection methods (BL<sub>I</sub>, ROAR<sub>Kp</sub>, ROAR<sub>Co</sub>) across varying levels of data perturbation (0%, 10%, 30%). The performance metric used is HIT@5, representing the proportion of times the correct answer is within the top 5 predictions. The charts are organized into three categories: Backdoor-Vulnerability, Backdoor-Diagnosis, Backdoor-Freebase, and Targeted-Vulnerability, Targeted-Diagnosis, Targeted-Freebase.
### Components/Axes
* **X-axis:** Represents the percentage of data perturbation (0%, 10%, 30%).
* **Y-axis:** Represents the HIT@5 score, ranging from 0.00 to 1.00.
* **Legend:** Located at the top-center of the image, defines the color-coding for each detection method:
* BL<sub>I</sub> (Light Green)
* ROAR<sub>Kp</sub> (Green)
* ROAR<sub>Co</sub> (Light Blue)
* BL<sub>II</sub> (Dark Blue)
* **Sub-Titles:** Each chart has a sub-title indicating the specific scenario being evaluated (e.g., "(a) Backdoor-Vulnerability").
### Detailed Analysis or Content Details
**Chart (a): Backdoor-Vulnerability**
* **BL<sub>I</sub> (Light Green):** The bar slopes upward. Values are approximately: 0% - 0.12, 10% - 0.71, 30% - 0.45.
* **ROAR<sub>Kp</sub> (Green):** The bar slopes downward. Values are approximately: 0% - 0.55, 10% - 0.04, 30% - 0.00.
* **ROAR<sub>Co</sub> (Light Blue):** The bar slopes downward. Values are approximately: 0% - 0.57, 10% - 0.45, 30% - 0.32.
**Chart (b): Backdoor-Diagnosis**
* **BL<sub>I</sub> (Light Green):** The bar slopes upward. Values are approximately: 0% - 0.22, 10% - 0.52, 30% - 0.30.
* **ROAR<sub>Kp</sub> (Green):** The bar slopes downward. Values are approximately: 0% - 0.13, 10% - 0.44, 30% - 0.08.
* **ROAR<sub>Co</sub> (Light Blue):** The bar slopes downward. Values are approximately: 0% - 0.39, 10% - 0.20, 30% - 0.00.
**Chart (c): Backdoor-Freebase**
* **BL<sub>I</sub> (Light Green):** The bar slopes upward. Values are approximately: 0% - 0.12, 10% - 0.62, 30% - 0.44.
* **ROAR<sub>Kp</sub> (Green):** The bar slopes downward. Values are approximately: 0% - 0.88, 10% - 0.56, 30% - 0.10.
* **ROAR<sub>Co</sub> (Light Blue):** The bar slopes downward. Values are approximately: 0% - 0.70, 10% - 0.04, 30% - 0.00.
**Chart (d): Targeted-Vulnerability**
* **BL<sub>I</sub> (Light Green):** The bar slopes downward. Values are approximately: 0% - 0.88, 10% - 0.72, 30% - 0.68.
* **ROAR<sub>Kp</sub> (Green):** The bar slopes downward. Values are approximately: 0% - 0.96, 10% - 0.80, 30% - 0.39.
* **ROAR<sub>Co</sub> (Light Blue):** The bar slopes downward. Values are approximately: 0% - 0.06, 10% - 0.13, 30% - 0.00.
**Chart (e): Targeted-Diagnosis**
* **BL<sub>I</sub> (Light Green):** The bar slopes downward. Values are approximately: 0% - 0.65, 10% - 0.54, 30% - 0.55.
* **ROAR<sub>Kp</sub> (Green):** The bar slopes downward. Values are approximately: 0% - 0.76, 10% - 0.68, 30% - 0.20.
* **ROAR<sub>Co</sub> (Light Blue):** The bar slopes downward. Values are approximately: 0% - 0.44, 10% - 0.00, 30% - 0.00.
**Chart (f): Targeted-Freebase**
* **BL<sub>I</sub> (Light Green):** The bar slopes downward. Values are approximately: 0% - 0.56, 10% - 0.62, 30% - 0.52.
* **ROAR<sub>Kp</sub> (Green):** The bar slopes downward. Values are approximately: 0% - 0.33, 10% - 0.41, 30% - 0.37.
* **ROAR<sub>Co</sub> (Light Blue):** The bar slopes downward. Values are approximately: 0% - 0.23, 10% - 0.00, 30% - 0.40.
### Key Observations
* BL<sub>I</sub> generally performs better at higher perturbation levels (10% and 30%) in the Backdoor scenarios, while ROAR methods degrade.
* ROAR<sub>Kp</sub> and ROAR<sub>Co</sub> consistently show a decline in performance as the perturbation level increases.
* In the Targeted scenarios, BL<sub>I</sub> and ROAR<sub>Kp</sub> generally maintain higher HIT@5 scores, but still exhibit a decreasing trend with increasing perturbation.
* ROAR<sub>Co</sub> consistently has the lowest performance across all scenarios and perturbation levels.
### Interpretation
The data suggests that the BL<sub>I</sub> method is more robust to data perturbation in the Backdoor scenarios, while the ROAR methods are more susceptible to performance degradation. In the Targeted scenarios, BL<sub>I</sub> and ROAR<sub>Kp</sub> demonstrate better performance, but all methods are affected by increasing perturbation. This indicates that the robustness of detection methods varies depending on the type of attack (Backdoor vs. Targeted) and the level of data manipulation. The consistent poor performance of ROAR<sub>Co</sub> suggests it may not be an effective detection method in these scenarios. The decreasing trend in HIT@5 scores with increasing perturbation highlights the vulnerability of these methods to adversarial attacks that aim to disrupt the data distribution. The charts provide a comparative analysis of different detection strategies under varying conditions, offering insights into their strengths and weaknesses.