## [Bar Charts (6 Subplots)]: HIT@5 Performance Across Methods and Tasks
### Overview
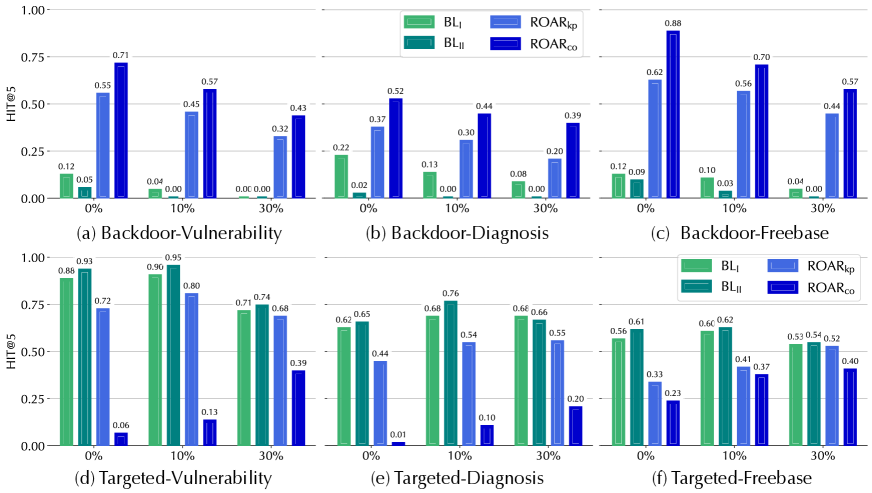
The image contains six bar charts (labeled (a)–(f)) organized in two rows (top: (a)–(c); bottom: (d)–(f)). Each chart compares four methods (BL₁, BL₂, ROARₖₚ, ROARₙₙ) across three categories (0%, 10%, 30%) on the x - axis, with the y - axis measuring “HIT@5” (a performance metric, likely hit rate at 5). Charts are grouped by task: *Backdoor* (a, b, c) and *Targeted* (d, e, f), with sub - tasks: Vulnerability, Diagnosis, Freebase.
### Components/Axes
- **Y - axis**: “HIT@5” (range: 0.00–1.00, ticks at 0.00, 0.25, 0.50, 0.75, 1.00).
- **X - axis**: Three categories: 0%, 10%, 30% (likely representing a percentage of data/perturbation).
- **Legend** (top - right of each subplot):
- BL₁ (light green)
- BL₂ (dark green)
- ROARₖₚ (light blue)
- ROARₙₙ (dark blue)
- **Chart Titles**:
- (a) Backdoor - Vulnerability
- (b) Backdoor - Diagnosis
- (c) Backdoor - Freebase
- (d) Targeted - Vulnerability
- (e) Targeted - Diagnosis
- (f) Targeted - Freebase
### Detailed Analysis (Per Chart)
We extract HIT@5 values for each method (BL₁, BL₂, ROARₖₚ, ROARₙₙ) at 0%, 10%, 30%:
#### Chart (a): Backdoor - Vulnerability
| Method | 0% | 10% | 30% |
|----------|------|------|------|
| BL₁ | ~0.12| ~0.04| ~0.00|
| BL₂ | ~0.05| ~0.00| ~0.00|
| ROARₖₚ | ~0.55| ~0.45| ~0.32|
| ROARₙₙ | ~0.71| ~0.57| ~0.43|
#### Chart (b): Backdoor - Diagnosis
| Method | 0% | 10% | 30% |
|----------|------|------|------|
| BL₁ | ~0.22| ~0.11| ~0.08|
| BL₂ | ~0.02| ~0.00| ~0.00|
| ROARₖₚ | ~0.37| ~0.30| ~0.20|
| ROARₙₙ | ~0.52| ~0.44| ~0.39|
#### Chart (c): Backdoor - Freebase
| Method | 0% | 10% | 30% |
|----------|------|------|------|
| BL₁ | ~0.12| ~0.10| ~0.04|
| BL₂ | ~0.09| ~0.03| ~0.00|
| ROARₖₚ | ~0.62| ~0.56| ~0.44|
| ROARₙₙ | ~0.88| ~0.70| ~0.57|
#### Chart (d): Targeted - Vulnerability
| Method | 0% | 10% | 30% |
|----------|------|------|------|
| BL₁ | ~0.88| ~0.90| ~0.71|
| BL₂ | ~0.93| ~0.95| ~0.74|
| ROARₖₚ | ~0.72| ~0.80| ~0.68|
| ROARₙₙ | ~0.06| ~0.13| ~0.39|
#### Chart (e): Targeted - Diagnosis
| Method | 0% | 10% | 30% |
|----------|------|------|------|
| BL₁ | ~0.62| ~0.68| ~0.68|
| BL₂ | ~0.65| ~0.76| ~0.66|
| ROARₖₚ | ~0.44| ~0.54| ~0.55|
| ROARₙₙ | ~0.01| ~0.10| ~0.20|
#### Chart (f): Targeted - Freebase
| Method | 0% | 10% | 30% |
|----------|------|------|------|
| BL₁ | ~0.56| ~0.60| ~0.53|
| BL₂ | ~0.61| ~0.62| ~0.54|
| ROARₖₚ | ~0.33| ~0.41| ~0.52|
| ROARₙₙ | ~0.23| ~0.37| ~0.40|
### Key Observations
1. **Task - Specific Performance**:
- *Backdoor Tasks (a–c)*: ROARₙₙ (dark blue) outperforms BL₁, BL₂, and ROARₖₚ across all percentages. BL₁/BL₂ have near - zero HIT@5 at 30% in (a) and (b).
- *Targeted Tasks (d–f)*: BL₁/BL₂ (green shades) outperform ROARₖₚ/ROARₙₙ. ROARₙₙ has near - zero HIT@5 at 0% in (d) and (e).
2. **Trend with Percentage (0% → 10% → 30%)**:
- In Backdoor tasks, HIT@5 *decreases* with increasing percentage (e.g., ROARₙₙ in (a): 0.71 → 0.57 → 0.43).
- In Targeted tasks, HIT@5 also *decreases* with increasing percentage (e.g., BL₁ in (d): 0.88 → 0.90 → 0.71).
3. **Method Hierarchy**:
- Backdoor: ROARₙₙ > ROARₖₚ > BL₁ > BL₂.
- Targeted: BL₂ > BL₁ > ROARₖₚ > ROARₙₙ.
### Interpretation
The charts compare HIT@5 (performance) of four methods across Backdoor/Targeted tasks (Vulnerability, Diagnosis, Freebase) and three percentage levels (0%, 10%, 30%):
- **Backdoor Tasks**: ROARₙₙ is most effective, suggesting it excels at backdoor - related detection/handling. BL₁/BL₂ struggle at higher percentages (30%), implying sensitivity to increased perturbation/data.
- **Targeted Tasks**: BL₁/BL₂ are more effective, indicating strength in targeted scenarios. ROARₙₙ’s poor performance here suggests it is ill - suited for targeted tasks.
- **Percentage Impact**: Higher percentages (30%) reduce HIT@5 across all methods, implying the task becomes harder with increased percentage (of data/perturbation).
This analysis identifies optimal methods for different task types (Backdoor vs. Targeted) and how performance scales with the percentage parameter.