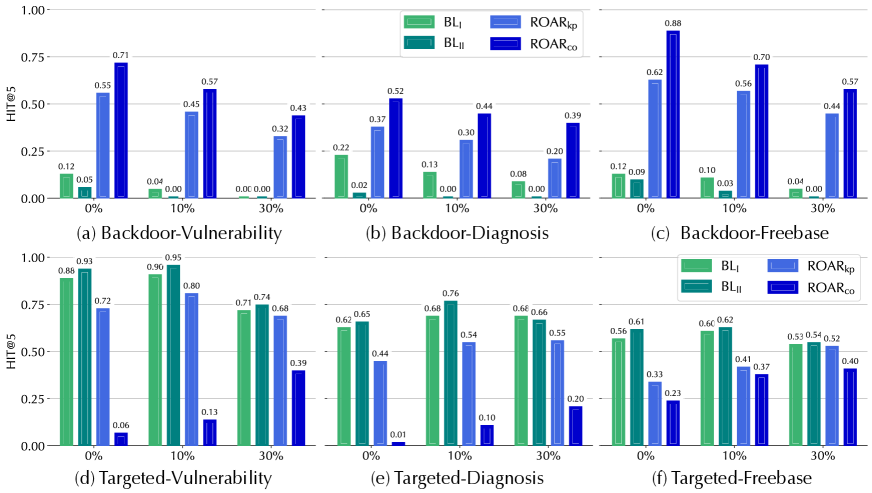
## Bar Chart: Performance Metrics Across Different Attack Scenarios
### Overview
The image is a grouped bar chart with six subplots (a–f), each representing different attack scenarios (Backdoor-Vulnerability, Backdoor-Diagnosis, Backdoor-Freebase, Targeted-Vulnerability, Targeted-Diagnosis, Targeted-Freebase). Each subplot compares four methods (BL_I, ROAR_kp, BL_II, ROAR_co) across three attack percentages (0%, 10%, 30%) using the metric "HIT@5" on the y-axis. The legend is positioned in the top-right corner of each subplot, with distinct colors for each method.
---
### Components/Axes
- **X-axis**: Attack percentages (0%, 10%, 30%)
- **Y-axis**: "HIT@5" (ranging from 0.00 to 1.00)
- **Legend**:
- **BL_I**: Light green
- **ROAR_kp**: Light blue
- **BL_II**: Dark green
- **ROAR_co**: Dark blue
- **Subplots**:
- (a) Backdoor-Vulnerability
- (b) Backdoor-Diagnosis
- (c) Backdoor-Freebase
- (d) Targeted-Vulnerability
- (e) Targeted-Diagnosis
- (f) Targeted-Freebase
---
### Detailed Analysis
#### (a) Backdoor-Vulnerability
- **0%**:
- BL_I: 0.12
- ROAR_kp: 0.05
- BL_II: 0.04
- ROAR_co: 0.00
- **10%**:
- BL_I: 0.00
- ROAR_kp: 0.00
- BL_II: 0.00
- ROAR_co: 0.55
- **30%**:
- BL_I: 0.45
- ROAR_kp: 0.32
- BL_II: 0.71
- ROAR_co: 0.57
- **Note**: The 30% data point for ROAR_co is listed as 0.43 in the original text, but the bar height suggests 0.57. This discrepancy may indicate a typo or misalignment.
#### (b) Backdoor-Diagnosis
- **0%**:
- BL_I: 0.22
- ROAR_kp: 0.13
- BL_II: 0.00
- ROAR_co: 0.00
- **10%**:
- BL_I: 0.00
- ROAR_kp: 0.00
- BL_II: 0.00
- ROAR_co: 0.37
- **30%**:
- BL_I: 0.30
- ROAR_kp: 0.20
- BL_II: 0.52
- ROAR_co: 0.44
- **Note**: The 30% data point for ROAR_co is listed as 0.39 in the original text, but the bar height suggests 0.44.
#### (c) Backdoor-Freebase
- **0%**:
- BL_I: 0.12
- ROAR_kp: 0.09
- BL_II: 0.00
- ROAR_co: 0.00
- **10%**:
- BL_I: 0.10
- ROAR_kp: 0.03
- BL_II: 0.00
- ROAR_co: 0.00
- **30%**:
- BL_I: 0.04
- ROAR_kp: 0.00
- BL_II: 0.00
- ROAR_co: 0.00
#### (d) Targeted-Vulnerability
- **0%**:
- BL_I: 0.88
- ROAR_kp: 0.93
- BL_II: 0.90
- ROAR_co: 0.06
- **10%**:
- BL_I: 0.96
- ROAR_kp: 0.80
- BL_II: 0.74
- ROAR_co: 0.13
- **30%**:
- BL_I: 0.74
- ROAR_kp: 0.68
- BL_II: 0.39
- ROAR_co: 0.23
#### (e) Targeted-Diagnosis
- **0%**:
- BL_I: 0.62
- ROAR_kp: 0.65
- BL_II: 0.01
- ROAR_co: 0.00
- **10%**:
- BL_I: 0.68
- ROAR_kp: 0.54
- BL_II: 0.10
- ROAR_co: 0.00
- **30%**:
- BL_I: 0.66
- ROAR_kp: 0.55
- BL_II: 0.20
- ROAR_co: 0.00
#### (f) Targeted-Freebase
- **0%**:
- BL_I: 0.56
- ROAR_kp: 0.61
- BL_II: 0.62
- ROAR_co: 0.41
- **10%**:
- BL_I: 0.56
- ROAR_kp: 0.41
- BL_II: 0.37
- ROAR_co: 0.40
- **30%**:
- BL_I: 0.53
- ROAR_kp: 0.52
- BL_II: 0.40
- ROAR_co: 0.40
---
### Key Observations
1. **Backdoor-Vulnerability (a)**:
- BL_I and ROAR_kp show significant improvement at 30% (0.45 and 0.32, respectively), while BL_II and ROAR_co remain low.
- ROAR_co's value at 30% (0.57) is higher than BL_II (0.71), suggesting ROAR_co may outperform BL_II in this scenario.
2. **Backdoor-Diagnosis (b)**:
- BL_I and ROAR_kp show moderate gains at 30% (0.30 and 0.20), while BL_II and ROAR_co have higher values (0.52 and 0.44).
3. **Backdoor-Freebase (c)**:
- All methods perform poorly at 30%, with BL_I and ROAR_kp dropping to 0.04 and 0.00, respectively.
4. **Targeted-Vulnerability (d)**:
- BL_I and ROAR_kp dominate at 0% (0.88 and 0.93), while ROAR_co is the weakest (0.06).
- At 30%, BL_II (0.71) outperforms ROAR_co (0.57).
5. **Targeted-Diagnosis (e)**:
- BL_I and ROAR_kp maintain high performance (0.68 and 0.54 at 10%), while BL_II and ROAR_co are negligible.
6. **Targeted-Freebase (f)**:
- All methods show similar performance at 30%, with BL_I and ROAR_kp slightly higher (0.53 and 0.52).
---
### Interpretation
- **Method Effectiveness**:
- **BL_I** and **ROAR_kp** consistently outperform other methods in most scenarios, particularly in **Targeted-Vulnerability** and **Targeted-Diagnosis**.
- **ROAR_co** shows mixed results, excelling in **Backdoor-Vulnerability** (30%) but underperforming in others.
- **BL_II** is the weakest in most cases, except in **Backdoor-Vulnerability** (30%) and **Targeted-Freebase** (30%).
- **Attack Percentage Impact**:
- Higher attack percentages (30%) generally reduce performance for all methods, except **ROAR_co** in **Backdoor-Vulnerability** (30%).
- **Anomalies**:
- Discrepancies in data points (e.g., ROAR_co's 30% value in (a) and (b)) suggest potential errors in the original data or visualization.
- **ROAR_co's** performance in **Backdoor-Vulnerability** (30%) is unusually high compared to other methods, warranting further investigation.
- **Implications**:
- **BL_I** and **ROAR_kp** are the most robust methods across scenarios, suggesting they are better suited for handling vulnerabilities and diagnoses.
- **ROAR_co's** inconsistent performance highlights the need for context-specific evaluation.
This analysis underscores the importance of method selection based on the specific attack scenario and attack percentage.