## Timing Diagram: Memory Access Schemes
### Overview
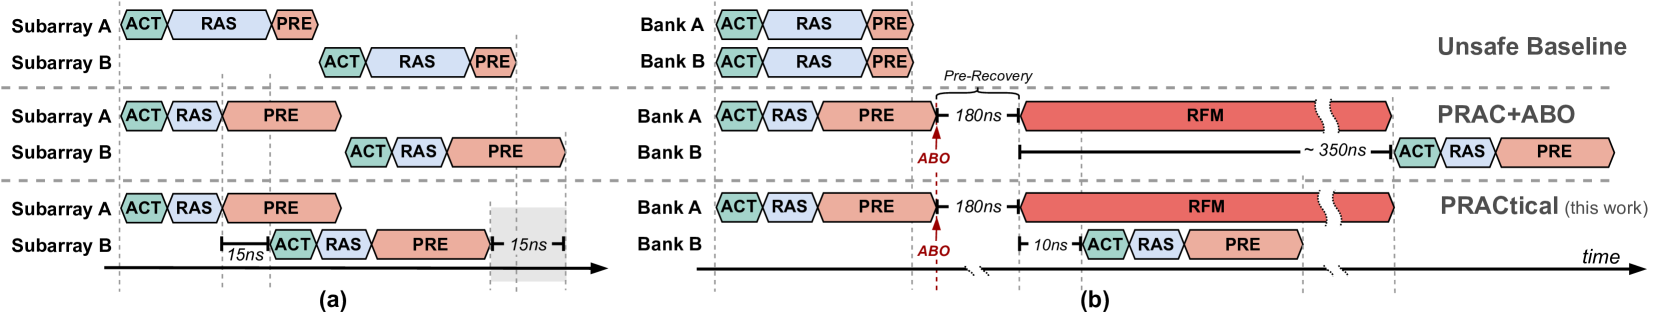
The image presents a timing diagram comparing three memory access schemes: an "Unsafe Baseline," "PRAC+ABO," and "PRACtical" (the proposed method). The diagram illustrates the sequence of operations (ACT, RAS, PRE, RFM) for accessing memory in subarrays and banks, highlighting the timing differences and potential optimizations achieved by the "PRACtical" approach.
### Components/Axes
* **Y-Axis:** Represents different memory components: Subarray A, Subarray B, Bank A, and Bank B. These are arranged vertically.
* **X-Axis:** Represents time, increasing from left to right.
* **Blocks:** Represent memory operations:
* ACT (Activate): Green
* RAS (Row Address Strobe): Blue
* PRE (Precharge): Light Red
* RFM (Row Fetch and Modify): Dark Red
* **Labels:**
* "Unsafe Baseline" (top-right)
* "PRAC+ABO" (middle-right)
* "PRACtical (this work)" (bottom-right)
* "Pre-Recovery" (above the PRAC+ABO RFM block)
* "ABO" (Arrow pointing to the PRE block in PRAC+ABO and PRACtical)
* "time" (bottom-right)
* "(a)" (bottom-left)
* "(b)" (bottom-right)
* **Timings:**
* 180ns (between PRE and RFM in PRAC+ABO and PRACtical)
* ~350ns (total time for PRAC+ABO)
* 15ns (delay between Subarray A and B in PRACtical)
* 10ns (delay between PRE and ACT in PRACtical)
### Detailed Analysis
**Part (a): Subarray Operations**
* **Unsafe Baseline:** Subarray A performs ACT, RAS, and PRE sequentially. Subarray B performs the same operations, starting after Subarray A completes.
* **PRAC+ABO:** Similar to the baseline, Subarray A performs ACT, RAS, and PRE sequentially. Subarray B performs the same operations, starting after Subarray A completes.
* **PRACtical:** Subarray A performs ACT, RAS, and PRE sequentially. Subarray B starts its ACT operation 15ns after Subarray A starts its ACT operation.
**Part (b): Bank Operations**
* **Unsafe Baseline:** Bank A performs ACT, RAS, and PRE sequentially. Bank B performs the same operations, starting after Bank A completes.
* **PRAC+ABO:** Bank A performs ACT, RAS, and PRE. After a "Pre-Recovery" time of 180ns, RFM is performed. The total time is approximately 350ns. An "ABO" arrow points to the PRE block. Bank B performs the same operations, starting after Bank A completes.
* **PRACtical:** Bank A performs ACT, RAS, and PRE. After a 180ns delay, RFM is performed. An "ABO" arrow points to the PRE block. Bank B starts its ACT operation 10ns after Bank A completes its PRE operation.
### Key Observations
* The "PRACtical" approach introduces a delay of 15ns between the start of operations in Subarray A and Subarray B.
* The "PRACtical" approach introduces a delay of 10ns between the PRE operation and the ACT operation in Bank B.
* Both "PRAC+ABO" and "PRACtical" involve a "Pre-Recovery" time of 180ns before the RFM operation.
* The "PRAC+ABO" method takes approximately 350ns to complete.
### Interpretation
The timing diagrams illustrate how the "PRACtical" approach optimizes memory access by overlapping operations in different subarrays and banks. By introducing small delays (15ns and 10ns), the "PRACtical" method aims to improve overall memory access performance compared to the "Unsafe Baseline" and "PRAC+ABO" methods. The "PRAC+ABO" method includes a "Pre-Recovery" time before the RFM operation, which is also present in the "PRACtical" method. The diagrams suggest that the "PRACtical" method reduces the overall access time by strategically overlapping operations. The "ABO" label likely refers to a specific optimization or technique related to precharge operations.