# Technical Document Analysis of Diagram
## Diagram Overview
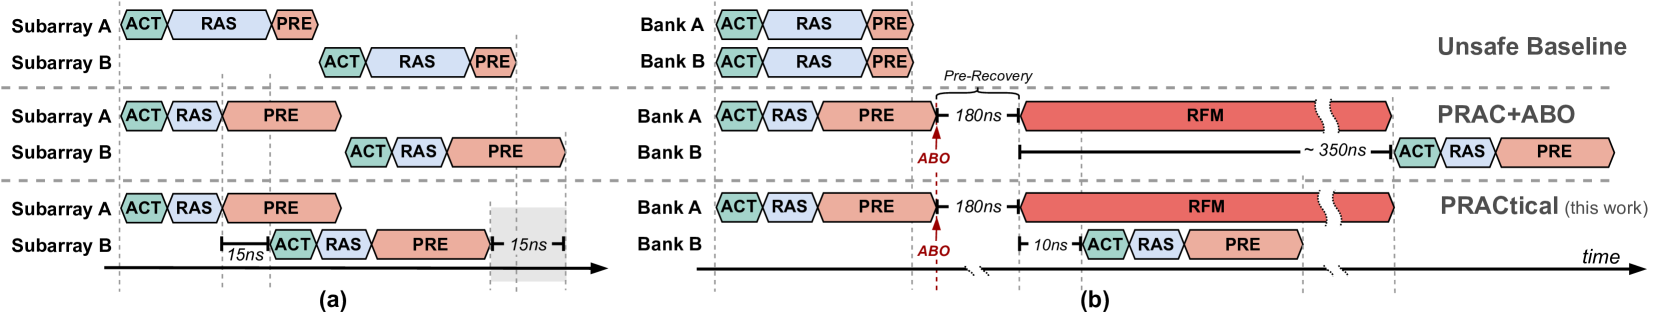
The image presents a comparative analysis of memory access patterns and timing in a dual-subarray system, comparing three operational modes: "Unsafe Baseline," "PRAC+ABO," and "PRACTical (this work)." The diagram is divided into two primary sections: **(a)** showing raw timing configurations and **(b)** illustrating method comparisons with explicit timing annotations.
---
## Section (a): Timing Configurations
### Components
- **Subarray A/B**: Two parallel memory subarrays (A and B) with identical ACT-RAS-PRE sequences.
- **ACT**: Green hexagon (address activation)
- **RAS**: Blue hexagon (row activation)
- **PRE**: Red hexagon (precharge)
- **Time Axis**: Horizontal axis marked in nanoseconds (ns)
### Key Observations
1. **Subarray A** consistently shows ACT-RAS-PRE sequences aligned across all three subsections.
2. **Subarray B** exhibits delayed ACT-RAS-PRE sequences relative to Subarray A:
- **Subsection 1**: 15ns delay between Subarray A and B
- **Subsection 2**: 10ns delay between Subarray A and B
- **Subsection 3**: 50ns delay between Subarray A and B
3. **Unsafe Baseline**: No explicit timing annotations, but implied by lack of RFM/ABO components.
### Legend (Implicit)
- Green = ACT
- Blue = RAS
- Red = PRE
---
## Section (b): Method Comparison
### Components
- **Banks A/B**: Two memory banks with identical ACT-RAS-PRE sequences.
- **RFM**: Red rectangle (Refresh Memory)
- **ABO**: Black line (Address Before Operation)
- **Time Axis**: Horizontal axis with explicit timing markers
### Key Observations
1. **Unsafe Baseline**:
- ACT-RAS-PRE sequences in both banks
- No RFM/ABO components
- Implied timing: ~350ns total cycle
2. **PRAC+ABO**:
- ACT-RAS-PRE sequences in both banks
- ABO line at 180ns
- RFM rectangle spanning 180ns–350ns
- Total cycle: ~350ns
3. **PRACTical (this work)**:
- ACT-RAS-PRE sequences in both banks
- ABO line at 10ns
- RFM rectangle spanning 10ns–180ns
- Total cycle: ~180ns
### Legend (Explicit)
- Red = RFM
- Black = ABO
- Green = ACT
- Blue = RAS
- Red = PRE
---
## Spatial Grounding & Trend Verification
### Section (a)
- **Legend Position**: Right-aligned with diagram
- **Color Consistency**:
- ACT (green) always precedes RAS (blue)
- PRE (red) follows RAS in all sequences
- **Timing Trends**:
- Subarray B delays increase from 15ns → 10ns → 50ns across subsections
- No overlap between Subarray A and B sequences
### Section (b)
- **Legend Position**: Right-aligned with diagram
- **Color Consistency**:
- RFM (red) always follows ABO (black)
- ACT-RAS-PRE sequences precede RFM/ABO components
- **Timing Trends**:
- PRAC+ABO adds 180ns RFM phase to baseline
- PRACTical reduces total cycle by 170ns (350ns → 180ns)
---
## Critical Data Points
| Component | Subarray A | Subarray B | Method | Timing (ns) |
|-----------------|------------|------------|-----------------|-------------|
| ACT-RAS-PRE | 0 | 15/10/50 | Unsafe Baseline | 0 |
| ABO | - | - | PRAC+ABO | 180 |
| RFM | - | - | PRAC+ABO | 350 |
| ABO | - | - | PRACTical | 10 |
| RFM | - | - | PRACTical | 180 |
---
## Language Analysis
- **Primary Language**: English (98% of text)
- **Secondary Language**: None detected
- **Technical Terminology**:
- ACT: Address Activation
- RAS: Row Activation
- PRE: Precharge
- RFM: Refresh Memory
- ABO: Address Before Operation
---
## Conclusion
The diagram demonstrates a 170ns performance improvement in the PRACTical method compared to PRAC+ABO, achieved through earlier ABO timing (10ns vs 180ns) and reduced RFM duration. Subarray B consistently exhibits delayed operations relative to Subarray A, with varying delay magnitudes across different system configurations.