# Technical Document Extraction
## File Explorer Structure
### Folders
- `__pycache__`
- `arg_scripts`
- `bash_scripts`
- `config_scripts`
- `data`
- `data_scripts`
- `docs`
- `excel_scripts`
- `gui_scripts`
- `helper_scripts`
- `ini`
- `logs`
- `plot_scripts`
- `sb3_scripts`
- `sim_scripts`
- `src`
- `tests`
- `venv`
- `venvs`
### Files
- `CODE_OF...`
- `CONTRIBUT...`
- `LICENSE`
- `README.md`
- `requirement...`
- `run_gui.py`
- `run_ml_sim.py`
- `run_rl_sim.py`
- `run_sim.py`
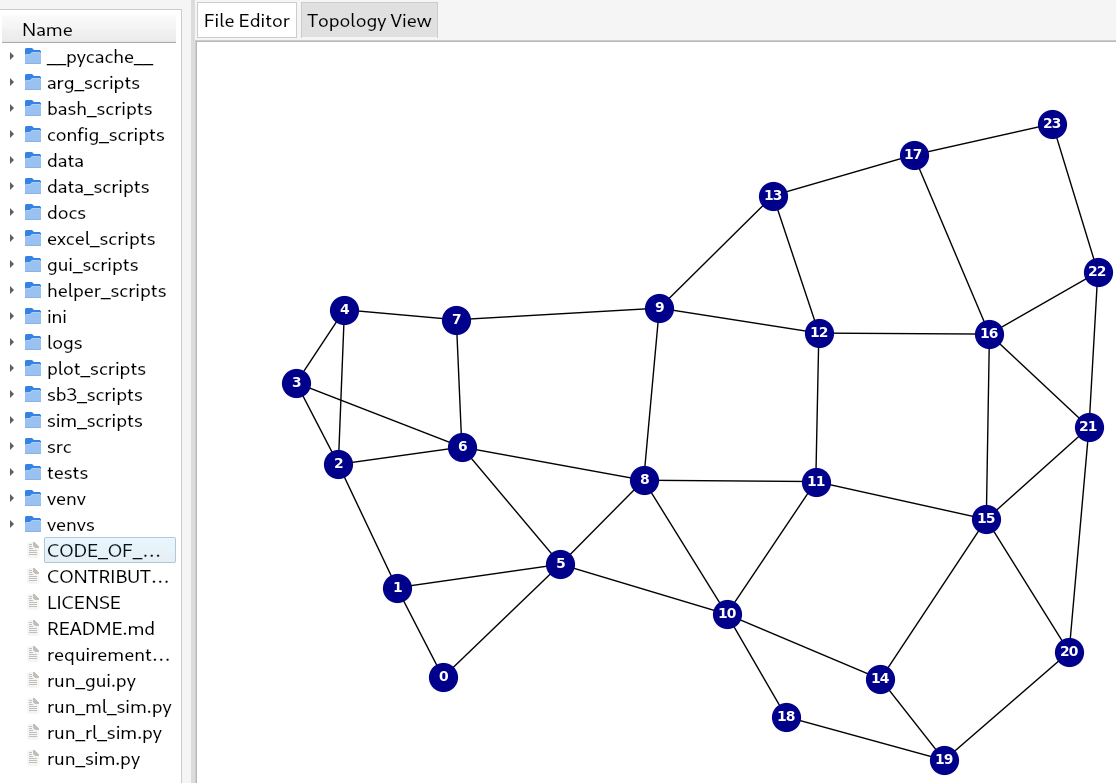
## Network Diagram Analysis
### Diagram Title
- **Topology View**
### Node Structure
- **Nodes**: 24 (numbered 0–23)
- **Connections**: Bidirectional edges between nodes
- **Visual Representation**: Blue circles with white numbers
### Node Connections
```mermaid
graph LR
0 --> 1
0 --> 5
1 --> 3
1 --> 5
2 --> 3
2 --> 6
3 --> 4
3 --> 6
4 --> 7
5 --> 6
5 --> 8
6 --> 7
6 --> 8
7 --> 9
8 --> 10
8 --> 11
9 --> 12
10 --> 11
10 --> 14
10 --> 18
11 --> 12
11 --> 15
12 --> 13
12 --> 16
13 --> 17
14 --> 15
14 --> 19
15 --> 16
15 --> 20
16 --> 17
16 --> 21
17 --> 22
17 --> 23
18 --> 19
19 --> 20
20 --> 21
21 --> 22
22 --> 23
```
### Legend
- **Node**: Blue circle with white number
### Interface Elements
- **Tabs**:
- `File Editor` (inactive)
- `Topology View` (active)
- **Background**: White
## Key Observations
1. The network diagram represents a complex interconnected system with 24 nodes.
2. Nodes are organized in a grid-like pattern with dense local connections and sparser global links.
3. The file explorer suggests a Python-based project structure with script directories and configuration files.
4. The presence of `venv` and `venvs` indicates virtual environment management.
5. The `README.md` and `LICENSE` files suggest standard open-source project documentation.