# Technical Document Extraction: Spectrogram Analysis
## 1. Image Classification and Overview
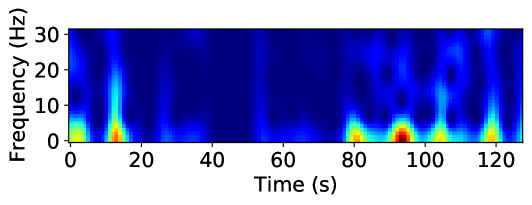
This image is a **spectrogram**, a visual representation of the spectrum of frequencies of a signal as it varies with time. It displays signal intensity (power) across a frequency range over a specific duration.
## 2. Component Isolation
### A. Header/Title
* No explicit title is present within the image frame.
### B. Main Chart Area (Heatmap)
* **Type:** 2D Heatmap (Time-Frequency-Intensity).
* **Color Scale (Implicit):**
* **Dark Blue:** Low intensity/power (background noise level).
* **Light Blue/Cyan:** Moderate intensity.
* **Yellow/Green:** High intensity.
* **Red/Dark Orange:** Peak intensity/maximum power.
### C. Axis Labels and Markers
* **Y-Axis (Vertical):**
* **Label:** `Frequency (Hz)`
* **Markers:** `0`, `10`, `20`, `30`
* **Range:** 0 to approximately 32 Hz.
* **X-Axis (Horizontal):**
* **Label:** `Time (s)`
* **Markers:** `0`, `20`, `40`, `60`, `80`, `100`, `120`
* **Range:** 0 to approximately 130 seconds.
---
## 3. Data Extraction and Trend Analysis
### Frequency Distribution
The signal power is predominantly concentrated in the **low-frequency range (0 Hz to 10 Hz)**. There are intermittent vertical "streaks" that extend into higher frequencies (up to 30 Hz), indicating transient broadband events.
### Temporal Events (Key Data Points)
The following high-intensity events are observed along the timeline:
1. **0 - 5 seconds:** A moderate-intensity burst (Yellow/Green) concentrated below 10 Hz.
2. **12 - 15 seconds:** A significant high-intensity spike. The core (Red) is at ~2 Hz, with a vertical tail (Cyan) reaching up to ~25 Hz.
3. **15 - 75 seconds:** A period of relative inactivity. The signal remains mostly dark blue (low power), with very faint activity around 40-50 seconds.
4. **80 seconds:** A high-intensity burst (Yellow/Orange) centered around 2-5 Hz.
5. **95 seconds:** The **peak intensity event** of the entire sample. A deep red core is visible between 0-5 Hz, with moderate intensity (Blue/Cyan) extending up to 10 Hz and faint circular patterns appearing at 20 Hz.
6. **105 seconds:** A high-intensity burst (Yellow) centered at ~3 Hz.
7. **120 seconds:** A high-intensity burst (Yellow/Orange) centered at ~2 Hz, with a vertical streak reaching up to ~15 Hz.
---
## 4. Summary of Visual Trends
* **Baseline:** The signal is characterized by a "quiet" baseline (Dark Blue) for the majority of the duration, particularly between 20s and 75s.
* **Periodicity:** Toward the end of the sample (80s - 130s), the high-intensity events appear more rhythmic or frequent compared to the beginning.
* **Spectral Shape:** Most energy is "bottom-heavy," meaning the physical phenomenon being measured is low-frequency in nature, with occasional sharp impulses that create broadband noise (vertical lines).
## 5. Language Declaration
The text in this image is entirely in **English**. No other languages were detected.