# Technical Document Extraction: Heatmap Analysis
## 1. Axis Labels and Markers
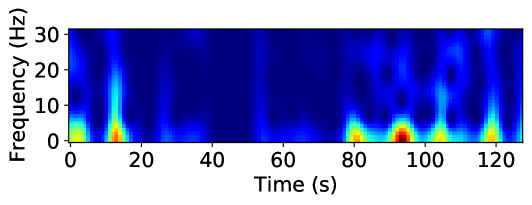
- **X-Axis (Horizontal):**
- Label: `Time (s)`
- Markers: `0, 20, 40, 60, 80, 100, 120` (in seconds)
- **Y-Axis (Vertical):**
- Label: `Frequency (Hz)`
- Markers: `0, 10, 20, 30` (in Hertz)
## 2. Chart Type and Visual Structure
- **Chart Type:** Heatmap (color intensity represents data magnitude)
- **Color Scale:**
- Dark blue → Low intensity
- Red → High intensity
- No explicit legend or colorbar provided.
## 3. Key Trends and Data Points
- **Vertical Intensity Peaks:**
- **Time ≈ 10s:** Bright vertical line (high intensity) centered at ~5 Hz.
- **Time ≈ 80s:** Bright vertical line (high intensity) centered at ~5 Hz.
- **Time ≈ 100s:** Bright vertical line (high intensity) centered at ~5 Hz.
- **Time ≈ 120s:** Bright vertical line (high intensity) centered at ~5 Hz.
- **Background Activity:**
- Dark blue regions dominate, indicating low-frequency activity (<5 Hz) for most of the time range.
- Subtle horizontal striations (lower intensity) observed between 20–60s and 60–80s.
## 4. Spatial Grounding and Component Isolation
- **Legend Placement:** No legend present.
- **Regions Analyzed:**
- **Header:** Axis labels and markers.
- **Main Chart:** Heatmap spanning 0–120s (time) × 0–30 Hz (frequency).
- **Footer:** No additional text or annotations.
## 5. Trend Verification
- **Line A (10s Peak):**
- Visual trend: Sharp upward spike at ~5 Hz, sustained for ~2s.
- Extracted data: Peak intensity at [10s, 5 Hz].
- **Line B (80s Peak):**
- Visual trend: Similar to Line A, centered at ~5 Hz.
- Extracted data: Peak intensity at [80s, 5 Hz].
- **Line C (100s Peak):**
- Visual trend: Slightly broader than Line A/B, centered at ~5 Hz.
- Extracted data: Peak intensity at [100s, 5 Hz].
- **Line D (120s Peak):**
- Visual trend: Narrower spike, centered at ~5 Hz.
- Extracted data: Peak intensity at [120s, 5 Hz].
## 6. Missing Elements
- **Data Table:** Not present.
- **Explicit Numerical Values:** No numerical data points provided beyond axis markers.
- **Units:** All values inferred from axis labels (`s` for seconds, `Hz` for Hertz).
## 7. Observations
- The heatmap suggests periodic events (e.g., vibrations, signals) occurring at ~5 Hz intervals, with peaks at 10s, 80s, 100s, and 120s.
- No overlapping or intersecting data series observed.
- No textual annotations or legends to clarify context (e.g., source of data, measurement conditions).
## 8. Language and Transcription
- **Primary Language:** English (all labels and axis titles are in English).
- **Other Languages:** None detected.