# Technical Document Extraction: AIME-25 Diversity Analysis
## Header
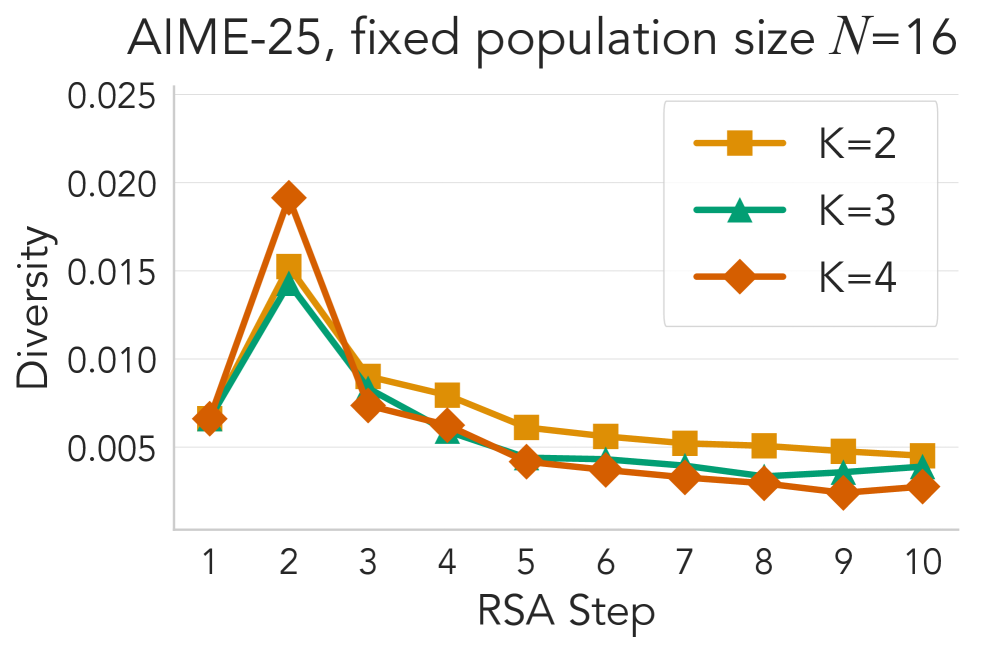
- **Title**: "AIME-25, fixed population size N=16"
- **Language**: English (no other languages detected)
## Main Chart
### Axes
- **X-axis**: "RSA Step" (integer values 1–10)
- **Y-axis**: "Diversity" (continuous scale from 0.005 to 0.025)
### Data Series
#### K=2 (Orange Squares)
- **Trend**:
- Starts at 0.006 (Step 1)
- Peaks at 0.016 (Step 2)
- Declines steadily to 0.005 (Step 10)
- **Key Points**:
- Step 1: 0.006
- Step 2: 0.016
- Step 3: 0.010
- Step 4: 0.008
- Step 5: 0.006
- Step 6: 0.006
- Step 7: 0.006
- Step 8: 0.006
- Step 9: 0.006
- Step 10: 0.005
#### K=3 (Green Triangles)
- **Trend**:
- Starts at 0.006 (Step 1)
- Peaks at 0.015 (Step 2)
- Declines steadily to 0.004 (Step 10)
- **Key Points**:
- Step 1: 0.006
- Step 2: 0.015
- Step 3: 0.009
- Step 4: 0.007
- Step 5: 0.005
- Step 6: 0.005
- Step 7: 0.005
- Step 8: 0.004
- Step 9: 0.004
- Step 10: 0.004
#### K=4 (Red Diamonds)
- **Trend**:
- Starts at 0.006 (Step 1)
- Peaks at 0.020 (Step 2)
- Declines steadily to 0.003 (Step 10)
- **Key Points**:
- Step 1: 0.006
- Step 2: 0.020
- Step 3: 0.008
- Step 4: 0.007
- Step 5: 0.005
- Step 6: 0.005
- Step 7: 0.004
- Step 8: 0.004
- Step 9: 0.003
- Step 10: 0.003
### Legend
- **Position**: Top-right corner
- **Components**:
- Orange square: K=2
- Green triangle: K=3
- Red diamond: K=4
## Spatial Grounding
- Legend confirmed in top-right quadrant.
- All data series align with legend colors/markers:
- K=2 (orange squares) matches orange line.
- K=3 (green triangles) matches green line.
- K=4 (red diamonds) matches red line.
## Trend Verification
- All series peak at RSA Step 2, then decline.
- K=4 maintains highest diversity throughout.
- K=2 and K=3 converge to similar values by Step 10.
## Component Isolation
1. **Header**: Title and population size.
2. **Main Chart**: Axes, data series, and trends.
3. **Legend**: Color-marker mappings.
## Conclusion
The chart illustrates diversity trends for K=2, K=3, and K=4 under fixed population size N=16. All series peak at RSA Step 2, with K=4 showing the highest diversity. Post-peak, diversity declines monotonically for all K values, with K=4 remaining dominant.