# Technical Data Extraction: AIME-25 Diversity Analysis
## 1. Document Header
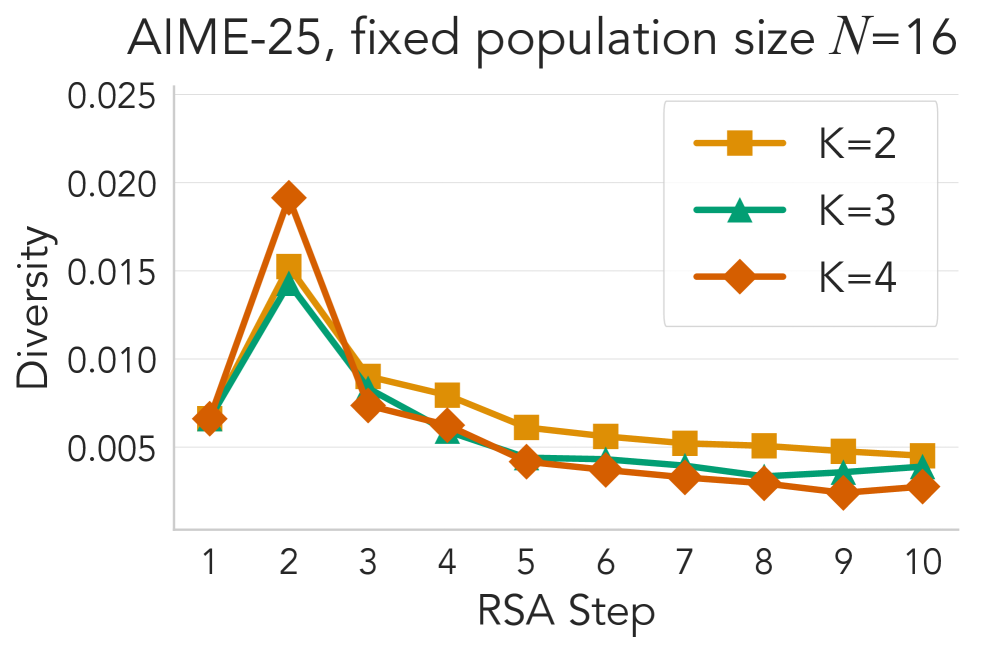
* **Title:** AIME-25, fixed population size $N=16$
* **Language:** English
## 2. Component Isolation
The image is a line graph depicting the relationship between iterative steps and population diversity across different parameter settings.
* **Header:** Contains the experiment title and fixed variable ($N=16$).
* **Main Chart Area:** A Cartesian coordinate system with three data series.
* **Legend:** Located in the upper-right quadrant.
* **Axes:**
* **Y-Axis (Vertical):** Labeled "Diversity". Scale ranges from 0.000 to 0.025 with major gridlines every 0.005.
* **X-Axis (Horizontal):** Labeled "RSA Step". Discrete integer markers from 1 to 10.
## 3. Legend and Data Series Identification
| Series Label | Color | Marker Shape | Visual Trend Description |
| :--- | :--- | :--- | :--- |
| **K=2** | Goldenrod / Yellow-Orange | Square | Sharp increase at step 2, followed by a gradual, steady decline. Remains the highest diversity series from step 4 onwards. |
| **K=4** | Blue | Circle | Initial peak at step 2, followed by a moderate decline. Maintains an intermediate diversity level between K=2 and K=8. |
| **K=8** | Green | Triangle | Initial peak at step 2, followed by the steepest decline among all series, reaching the lowest diversity by step 10. |