## Chart: SmolLM2-1.7B Flips Proportion vs Iterations
### Overview
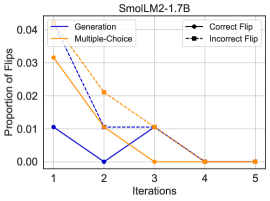
The image is a line chart comparing the proportion of flips across iterations for different methods (Generation, Multiple-Choice) and flip types (Correct Flip, Incorrect Flip) using the SmolLM2-1.7B model. The x-axis represents the number of iterations, and the y-axis represents the proportion of flips.
### Components/Axes
* **Title:** SmolLM2-1.7B
* **X-axis:** Iterations (1, 2, 3, 4, 5)
* **Y-axis:** Proportion of Flips (0.00, 0.01, 0.02, 0.03, 0.04)
* **Legend:** Located at the top-left and top-right of the chart.
* **Generation:** Solid blue line
* **Multiple-Choice:** Solid orange line
* **Correct Flip:** Black line with circle markers
* **Incorrect Flip:** Dashed black line with square markers
### Detailed Analysis
* **Generation (Solid Blue Line):**
* Trend: Decreasing from iteration 1 to 2, then relatively constant from iteration 2 to 3, then decreasing to 0 at iteration 4.
* Data Points:
* Iteration 1: Approximately 0.01
* Iteration 2: Approximately 0.00
* Iteration 3: Approximately 0.01
* Iteration 4: Approximately 0.00
* Iteration 5: Approximately 0.00
* **Multiple-Choice (Solid Orange Line):**
* Trend: Decreasing from iteration 1 to 4, then constant from iteration 4 to 5.
* Data Points:
* Iteration 1: Approximately 0.032
* Iteration 2: Approximately 0.021
* Iteration 3: Approximately 0.00
* Iteration 4: Approximately 0.00
* Iteration 5: Approximately 0.00
* **Correct Flip (Black Line with Circle Markers):**
* Trend: Increasing from iteration 1 to 3, then decreasing to 0 at iteration 4.
* Data Points:
* Iteration 1: Approximately 0.00
* Iteration 2: Approximately 0.01
* Iteration 3: Approximately 0.01
* Iteration 4: Approximately 0.00
* Iteration 5: Approximately 0.00
* **Incorrect Flip (Dashed Black Line with Square Markers):**
* Trend: Decreasing from iteration 1 to 4, then constant from iteration 4 to 5.
* Data Points:
* Iteration 1: Approximately 0.035
* Iteration 2: Approximately 0.01
* Iteration 3: Approximately 0.00
* Iteration 4: Approximately 0.00
* Iteration 5: Approximately 0.00
### Key Observations
* The "Generation" method shows a sharp decrease in the proportion of flips between iterations 1 and 2.
* The "Multiple-Choice" method consistently decreases in the proportion of flips as iterations increase.
* The "Correct Flip" proportion peaks at iteration 3.
* Both "Multiple-Choice", "Correct Flip", and "Incorrect Flip" converge to 0 after iteration 3 or 4.
### Interpretation
The chart illustrates how the proportion of flips changes over iterations for different methods and flip types in the SmolLM2-1.7B model. The "Multiple-Choice" method appears to be more effective in reducing the proportion of flips compared to the "Generation" method, as it consistently decreases with each iteration. The "Correct Flip" proportion initially increases, suggesting that the model is learning to correct its flips up to a certain point (iteration 3), after which it decreases. The "Incorrect Flip" proportion decreases, indicating that the model is making fewer incorrect flips as iterations progress. The convergence of "Multiple-Choice", "Correct Flip", and "Incorrect Flip" to 0 suggests that the model stabilizes after a few iterations, with minimal flips occurring.