## Line Chart: Proportion of Flips vs. Iterations for SmolLM2-1.7B
### Overview
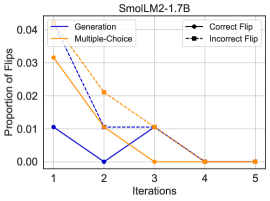
This line chart depicts the proportion of flips observed across different iterations for the SmolLM2-1.7B model, comparing performance between "Generation", "Multiple-Choice", "Correct Flip", and "Incorrect Flip" methods. The x-axis represents the iteration number (1 to 5), and the y-axis represents the proportion of flips, ranging from 0.00 to 0.04.
### Components/Axes
* **Title:** SmolLM2-1.7B (positioned at the top-center)
* **X-axis Label:** Iterations (positioned at the bottom-center)
* Axis Markers: 1, 2, 3, 4, 5
* **Y-axis Label:** Proportion of Flips (positioned at the left-center)
* Axis Scale: 0.00, 0.01, 0.02, 0.03, 0.04
* **Legend:** Located at the top-right corner.
* Generation (Blue Solid Line)
* Multiple-Choice (Orange Solid Line)
* Correct Flip (Black Dashed Line)
* Incorrect Flip (Black Dotted Line)
### Detailed Analysis
* **Generation (Blue Solid Line):** The line starts at approximately 0.011, decreases to approximately 0.002 at iteration 2, remains relatively stable at approximately 0.008-0.01 at iterations 3 and 4, and ends at approximately 0.006 at iteration 5.
* **Multiple-Choice (Orange Solid Line):** The line begins at approximately 0.032, drops to approximately 0.021 at iteration 2, continues to approximately 0.011 at iteration 3, and reaches 0.00 at iteration 4, remaining at 0.00 for iteration 5.
* **Correct Flip (Black Dashed Line):** The line starts at approximately 0.034, decreases to approximately 0.022 at iteration 2, then to approximately 0.01 at iteration 3, and reaches 0.00 at iteration 4, remaining at 0.00 for iteration 5.
* **Incorrect Flip (Black Dotted Line):** The line begins at approximately 0.031, decreases to approximately 0.02 at iteration 2, then to approximately 0.01 at iteration 3, and reaches 0.00 at iteration 4, remaining at 0.00 for iteration 5.
### Key Observations
* All four lines demonstrate a decreasing trend in the proportion of flips as the number of iterations increases.
* The "Multiple-Choice", "Correct Flip", and "Incorrect Flip" lines converge to 0.00 at iteration 4, indicating that no flips were observed for these methods after that point.
* The "Generation" line exhibits a more fluctuating pattern compared to the others, with a slight increase between iterations 3 and 4.
* Initially, the "Multiple-Choice" and "Correct Flip" methods have the highest proportion of flips.
### Interpretation
The data suggests that the SmolLM2-1.7B model improves its consistency and reduces the occurrence of "flips" (presumably, changes in predictions or classifications) with each iteration. The rapid decline in flips for "Multiple-Choice", "Correct Flip", and "Incorrect Flip" indicates that these methods quickly converge to a stable state. The "Generation" method, while also decreasing, shows more variability, potentially indicating a more complex learning process or sensitivity to initial conditions. The convergence of all lines to zero after a certain number of iterations suggests that the model reaches a point of diminishing returns in terms of reducing flips. The initial higher flip rate for "Multiple-Choice" and "Correct Flip" could be due to the model initially exploring different possibilities before settling on a more consistent solution. This data could be used to evaluate the effectiveness of different training strategies and to determine the optimal number of iterations for the SmolLM2-1.7B model.