## Line Chart: SmolLM2-1.7B Flip Proportions Over Iterations
### Overview
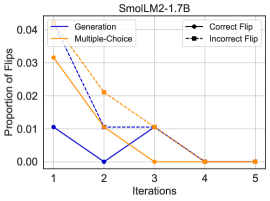
The image is a line chart titled "SmolLM2-1.7B". It plots the "Proportion of Flips" against the number of "Iterations" (from 1 to 5) for four distinct data series. The chart appears to track the stability or change rate of a model's outputs across sequential evaluation or training iterations.
### Components/Axes
* **Chart Title:** SmolLM2-1.7B (Top Center)
* **Y-Axis:**
* **Label:** Proportion of Flips
* **Scale:** Linear, from 0.00 to 0.04, with major tick marks at 0.00, 0.01, 0.02, 0.03, and 0.04.
* **X-Axis:**
* **Label:** Iterations
* **Scale:** Discrete, with markers at integers 1, 2, 3, 4, and 5.
* **Legend:** Located in the top-right corner of the plot area.
* **Generation:** Blue solid line with circle markers.
* **Multiple-Choice:** Orange dashed line with square markers.
* **Correct Flip:** Gray dotted line with diamond markers.
* **Incorrect Flip:** Black dash-dot line with 'x' markers.
### Detailed Analysis
**Trend Verification & Data Point Extraction:**
1. **Generation (Blue, solid line, circles):**
* **Trend:** Starts at the highest point, drops sharply, then stabilizes near zero.
* **Data Points:**
* Iteration 1: ~0.033
* Iteration 2: ~0.000
* Iteration 3: ~0.010
* Iteration 4: ~0.000
* Iteration 5: ~0.000
2. **Multiple-Choice (Orange, dashed line, squares):**
* **Trend:** Starts high, decreases steadily, and flattens out after iteration 3.
* **Data Points:**
* Iteration 1: ~0.030
* Iteration 2: ~0.020
* Iteration 3: ~0.010
* Iteration 4: ~0.000
* Iteration 5: ~0.000
3. **Correct Flip (Gray, dotted line, diamonds):**
* **Trend:** Starts low, shows a minor peak at iteration 3, then declines to zero.
* **Data Points:**
* Iteration 1: ~0.010
* Iteration 2: ~0.010
* Iteration 3: ~0.010
* Iteration 4: ~0.000
* Iteration 5: ~0.000
4. **Incorrect Flip (Black, dash-dot line, 'x's):**
* **Trend:** Starts low and quickly drops to near zero, remaining flat.
* **Data Points:**
* Iteration 1: ~0.010
* Iteration 2: ~0.000
* Iteration 3: ~0.000
* Iteration 4: ~0.000
* Iteration 5: ~0.000
### Key Observations
* **Convergence:** All four metrics converge to a proportion of 0.00 by iteration 4 and remain there at iteration 5.
* **Initial Disparity:** At iteration 1, there is a clear hierarchy: "Generation" and "Multiple-Choice" flips are significantly higher (~0.030-0.033) than "Correct" and "Incorrect" flips (~0.010).
* **Rate of Decline:** "Generation" flips show the most dramatic single-step drop (from ~0.033 to ~0.000 between iterations 1 and 2). "Multiple-Choice" flips decline more gradually.
* **Stability of Low Values:** The "Incorrect Flip" series reaches and maintains a value of ~0.000 from iteration 2 onward, suggesting this type of flip becomes negligible very early in the process.
### Interpretation
This chart likely illustrates the stabilization of a language model (SmolLM2-1.7B) during a process like iterative refinement, self-correction, or multi-turn evaluation. The "Proportion of Flips" probably measures how often the model changes its output (a "flip") between iterations.
* **What the data suggests:** The model's outputs become increasingly stable with more iterations. The high initial flip rates for "Generation" and "Multiple-Choice" suggest significant early-stage revision, which rapidly diminishes. The near-zero flip rates after iteration 3 indicate the model has reached a consistent state where further iterations produce little to no change.
* **How elements relate:** The different series may categorize the *type* of flip. "Generation" vs. "Multiple-Choice" could refer to the task format, while "Correct" vs. "Incorrect" might refer to whether a flip led to a better or worse answer. The fact that all converge to zero implies the process successfully eliminates instability, regardless of flip type.
* **Notable anomaly:** The "Correct Flip" series has a slight plateau or minor peak at iteration 3 (~0.010) while others are declining. This could indicate a final round of beneficial corrections before full stabilization.
* **Overall implication:** The process being measured is effective at reducing output volatility. For practical purposes, running beyond 3-4 iterations may yield diminishing returns, as the model's outputs have already stabilized.