## Line Chart: Proportion of Flips Over Iterations for SmolLM2-1.7B
### Overview
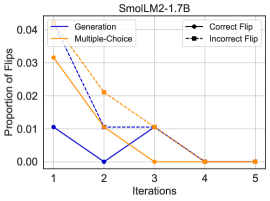
The chart illustrates the proportion of flips (likely correct or incorrect) for two methods—**Generation** and **Multiple-Choice**—across 5 iterations. The y-axis represents the proportion of flips (0.00 to 0.04), and the x-axis represents iterations (1 to 5). Two lines are plotted: a solid blue line for **Generation** and a dashed orange line for **Multiple-Choice**.
### Components/Axes
- **X-axis (Iterations)**: Labeled "Iterations" with values 1 to 5.
- **Y-axis (Proportion of Flips)**: Labeled "Proportion of Flips" with values from 0.00 to 0.04.
- **Legend**:
- **Generation**: Solid blue line.
- **Multiple-Choice**: Dashed orange line.
- **Correct Flip**: Solid (matches Generation line).
- **Incorrect Flip**: Dashed (matches Multiple-Choice line).
### Detailed Analysis
- **Generation (Solid Blue Line)**:
- Iteration 1: ~0.04
- Iteration 2: ~0.01
- Iteration 3: ~0.005
- Iteration 4: ~0.002
- Iteration 5: ~0.001
- **Trend**: Steeply decreasing from 0.04 to 0.001, with a sharp drop between iterations 1 and 2.
- **Multiple-Choice (Dashed Orange Line)**:
- Iteration 1: ~0.03
- Iteration 2: ~0.02
- Iteration 3: ~0.01
- Iteration 4: ~0.005
- Iteration 5: ~0.005
- **Trend**: Gradual decrease from 0.03 to 0.005, with a plateau at iteration 5.
### Key Observations
1. **Generation** shows a more pronounced decline in the proportion of flips compared to **Multiple-Choice**.
2. Both methods exhibit a downward trend, suggesting a reduction in flip frequency over iterations.
3. **Multiple-Choice** stabilizes at iteration 5, while **Generation** continues to decrease.
### Interpretation
The data suggests that both **Generation** and **Multiple-Choice** methods experience a reduction in flip proportions as iterations increase. The steeper decline in **Generation** may indicate faster convergence or stabilization, while the plateau in **Multiple-Choice** could imply a different optimization dynamic. The legend’s association of **Correct Flip** with the solid line (Generation) and **Incorrect Flip** with the dashed line (Multiple-Choice) implies that the lines represent the proportion of correct flips for each method. This trend might reflect improvements in model performance or error correction over iterations. However, without explicit labels for "Correct" vs. "Incorrect" in the data, this interpretation relies on the legend’s visual cues.