## Line Chart: Accuracy vs. Top-k Tokens for Decoding Paths
### Overview
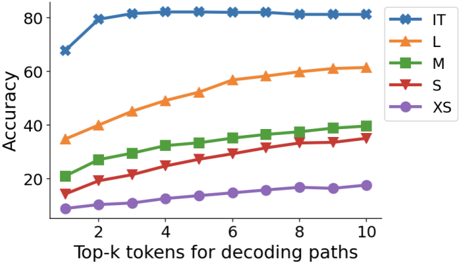
The image is a line chart comparing the accuracy of different models (IT, L, M, S, XS) based on the number of top-k tokens used for decoding paths. The x-axis represents the number of top-k tokens, ranging from 1 to 10. The y-axis represents the accuracy, ranging from 0 to 80.
### Components/Axes
* **X-axis:** "Top-k tokens for decoding paths" with values 1, 2, 4, 6, 8, 10.
* **Y-axis:** "Accuracy" with values 20, 40, 60, 80.
* **Legend:** Located in the top-right corner, it identifies each line by model size:
* Blue line with "x" markers: IT
* Orange line with triangle markers: L
* Green line with square markers: M
* Red line with inverted triangle markers: S
* Purple line with circle markers: XS
### Detailed Analysis
* **IT (Blue, "x" markers):** The line starts at approximately 68% accuracy at k=1, rises sharply to approximately 80% at k=2, and then remains relatively flat around 82% for k=3 to k=10.
* (1, 68%)
* (2, 80%)
* (4, 82%)
* (6, 82%)
* (8, 82%)
* (10, 82%)
* **L (Orange, triangle markers):** The line starts at approximately 34% accuracy at k=1 and gradually increases to approximately 60% at k=10.
* (1, 34%)
* (2, 40%)
* (4, 50%)
* (6, 56%)
* (8, 60%)
* (10, 61%)
* **M (Green, square markers):** The line starts at approximately 22% accuracy at k=1 and gradually increases to approximately 37% at k=10.
* (1, 22%)
* (2, 28%)
* (4, 32%)
* (6, 35%)
* (8, 37%)
* (10, 37%)
* **S (Red, inverted triangle markers):** The line starts at approximately 14% accuracy at k=1 and gradually increases to approximately 35% at k=10.
* (1, 14%)
* (2, 20%)
* (4, 25%)
* (6, 30%)
* (8, 33%)
* (10, 35%)
* **XS (Purple, circle markers):** The line starts at approximately 9% accuracy at k=1 and gradually increases to approximately 18% at k=10.
* (1, 9%)
* (2, 11%)
* (4, 14%)
* (6, 16%)
* (8, 17%)
* (10, 18%)
### Key Observations
* The "IT" model achieves the highest accuracy and plateaus quickly after k=2.
* The "L" model shows a steady increase in accuracy as the number of top-k tokens increases.
* The "M", "S", and "XS" models have lower accuracy compared to "IT" and "L", with "XS" having the lowest overall accuracy.
* All models show an increase in accuracy as the number of top-k tokens increases, but the rate of increase varies.
### Interpretation
The chart demonstrates the relationship between the number of top-k tokens used for decoding paths and the accuracy of different models. The "IT" model appears to be the most effective, achieving high accuracy with a relatively small number of tokens. The other models ("L", "M", "S", and "XS") show a more gradual increase in accuracy as the number of tokens increases, suggesting that they benefit more from considering a larger set of possible decoding paths. The performance differences likely reflect the model sizes and architectures, with "IT" possibly being a larger or more sophisticated model. The diminishing returns observed for all models suggest that there is a point beyond which increasing the number of top-k tokens provides little additional benefit in terms of accuracy.