\n
## Line Chart: Accuracy vs. Top-k Tokens for Decoding Paths
### Overview
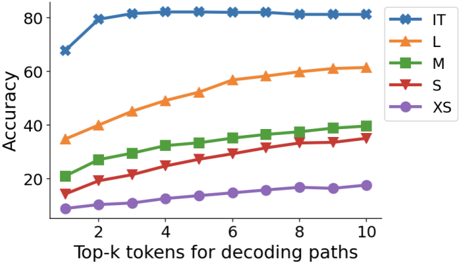
This line chart depicts the relationship between the accuracy of a model and the number of top-k tokens used for decoding paths. Five different model sizes (XS, S, M, L, and IT) are compared across a range of top-k values from 1 to 10. The y-axis represents accuracy, while the x-axis represents the top-k tokens.
### Components/Axes
* **X-axis Title:** "Top-k tokens for decoding paths"
* Scale: 1, 2, 4, 6, 8, 10
* **Y-axis Title:** "Accuracy"
* Scale: 0, 20, 40, 60, 80
* **Legend:** Located in the top-right corner.
* IT (Dark Blue)
* L (Orange)
* M (Green)
* S (Red)
* XS (Purple)
### Detailed Analysis
The chart displays five lines, each representing a different model size.
* **IT (Dark Blue):** The line starts at approximately 68% accuracy at a top-k value of 1. It rapidly increases to approximately 84% at a top-k value of 2, and then plateaus, remaining relatively stable around 84-86% for the rest of the range (up to top-k = 10).
* **L (Orange):** The line begins at approximately 42% accuracy at a top-k value of 1. It shows a consistent upward trend, increasing to approximately 63% accuracy at a top-k value of 10.
* **M (Green):** The line starts at approximately 22% accuracy at a top-k value of 1. It exhibits a gradual upward trend, reaching approximately 42% accuracy at a top-k value of 10.
* **S (Red):** The line begins at approximately 14% accuracy at a top-k value of 1. It shows a moderate upward trend, increasing to approximately 34% accuracy at a top-k value of 10.
* **XS (Purple):** The line starts at approximately 8% accuracy at a top-k value of 1. It displays a slow upward trend, reaching approximately 20% accuracy at a top-k value of 10.
### Key Observations
* The "IT" model consistently achieves the highest accuracy across all top-k values.
* All models demonstrate an increase in accuracy as the top-k value increases, but the rate of increase varies.
* The "IT" model shows diminishing returns in accuracy beyond a top-k value of 2.
* The "XS" model consistently has the lowest accuracy.
* The gap in accuracy between the "IT" model and the other models widens as the top-k value increases.
### Interpretation
The data suggests that increasing the number of top-k tokens for decoding paths generally improves model accuracy, but there is a point of diminishing returns, particularly for the "IT" model. The "IT" model, being the largest, benefits the most from a larger search space (higher top-k) initially, but quickly reaches a saturation point. Smaller models ("XS", "S", "M", "L") continue to see improvements in accuracy with increasing top-k values, indicating they are more sensitive to the size of the decoding path search space. This could be due to the larger models having a more robust internal representation of the data, making them less reliant on exploring a wider range of decoding paths. The consistent performance difference between the models suggests that model size is a significant factor in achieving high accuracy in this task. The chart highlights a trade-off between computational cost (larger top-k values require more computation) and accuracy.