## Line Chart: Accuracy vs. Top-k Tokens for Decoding Paths
### Overview
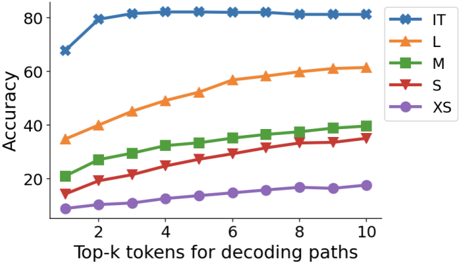
The image displays a line chart comparing the performance (accuracy) of five different models or configurations (labeled IT, L, M, S, XS) as a function of the number of top-k tokens considered during a decoding process. All series show a positive correlation between the number of tokens (k) and accuracy, but the absolute performance levels and rates of improvement differ significantly.
### Components/Axes
* **Y-Axis:** Labeled "Accuracy". Scale ranges from 0 to 80, with major tick marks at intervals of 20 (0, 20, 40, 60, 80).
* **X-Axis:** Labeled "Top-k tokens for decoding paths". Scale shows discrete integer values from 1 to 10, with major tick marks labeled at 2, 4, 6, 8, and 10.
* **Legend:** Positioned in the top-right corner, inside the plot area. It contains five entries:
* **IT:** Blue line with star (`*`) markers.
* **L:** Orange line with upward-pointing triangle (`^`) markers.
* **M:** Green line with square (`s`) markers.
* **S:** Red line with downward-pointing triangle (`v`) markers.
* **XS:** Purple line with circle (`o`) markers.
### Detailed Analysis
**Trend Verification & Data Points (Approximate):**
* **IT (Blue, Stars):** This series exhibits the highest accuracy. It shows a sharp initial increase from ~70 at k=1 to ~80 at k=2, followed by a near-plateau, reaching approximately 82-83 by k=10. The trend is a rapid rise followed by saturation.
* **L (Orange, Up-Triangles):** The second-highest performing series. It demonstrates a steady, concave-down upward trend. Starts at ~35 (k=1), passes ~45 (k=4), ~55 (k=7), and ends at ~60 (k=10).
* **M (Green, Squares):** Shows a consistent upward trend below series L. Starts at ~20 (k=1), reaches ~30 (k=5), and ends at ~40 (k=10).
* **S (Red, Down-Triangles):** Follows a similar upward trajectory to M but at a lower accuracy level. Starts at ~15 (k=1), crosses ~25 (k=6), and ends at ~35 (k=10).
* **XS (Purple, Circles):** The lowest-performing series. It increases slowly from ~5 (k=1) to ~18 (k=10).
**Spatial Grounding:** The legend is clearly placed in the upper right quadrant of the chart, ensuring it does not obscure the data lines, which all originate from the left side and trend upward to the right.
### Key Observations
1. **Performance Hierarchy:** There is a clear and consistent performance hierarchy across all values of k: IT > L > M > S > XS. The gap between the top model (IT) and the others is substantial.
2. **Diminishing Returns:** All models show diminishing returns as k increases. The slope of improvement is steepest between k=1 and k=4 for all series, and becomes progressively flatter.
3. **Saturation Point:** The IT model reaches a performance saturation point very early (around k=2 or k=3), after which additional tokens yield minimal accuracy gains. The smaller models (L, M, S, XS) continue to show more noticeable, though still diminishing, improvements up to k=10.
4. **Relative Improvement:** While the absolute accuracy is lower for smaller models (XS, S), their *relative* improvement from k=1 to k=10 is proportionally larger than that of the IT model.
### Interpretation
This chart likely illustrates the trade-off between computational cost (implied by considering more top-k tokens) and output quality (accuracy) for language model decoding strategies of varying sizes or capacities (from Extra Small to a presumably larger "IT" model).
* **What the data suggests:** Larger, more capable models (IT) achieve high accuracy even with a very narrow search (low k), suggesting they generate high-probability tokens that are already correct. Smaller models (XS, S) require a broader search (higher k) to find acceptable outputs, indicating their top-ranked tokens are less reliable.
* **How elements relate:** The x-axis (k) represents a knob for controlling the exploration-exploitation balance during generation. The y-axis (Accuracy) measures the success of that strategy. The different lines show that the optimal setting for this knob is model-dependent.
* **Notable implication:** For resource-constrained applications using smaller models, increasing the decoding path width (k) is a viable strategy to boost performance, albeit with increased latency. For large, high-quality models, a small k is sufficient, allowing for faster inference without sacrificing accuracy. The chart provides empirical evidence for selecting efficient decoding parameters based on model size.