## Line Chart: Model Accuracy vs. Top-k Tokens for Decoding Paths
### Overview
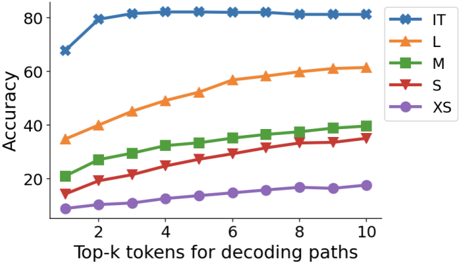
The image is a line chart comparing the accuracy of five models (IT, L, M, S, XS) across varying numbers of top-k tokens used for decoding paths. Accuracy is measured on the y-axis (0–80%), and the x-axis represents the number of top-k tokens (2–10). Each model is represented by a distinct colored line with unique markers.
### Components/Axes
- **Y-Axis**: "Accuracy" (0–80%, increments of 20).
- **X-Axis**: "Top-k tokens for decoding paths" (2–10, increments of 2).
- **Legend**: Located in the top-right corner, mapping colors/markers to models:
- **IT**: Blue line with star markers (★).
- **L**: Orange line with triangle markers (▲).
- **M**: Green line with square markers (■).
- **S**: Red line with diamond markers (◆).
- **XS**: Purple line with circle markers (●).
### Detailed Analysis
1. **IT (Blue ★)**:
- Starts at ~70% accuracy for k=2.
- Peaks at ~80% for k=4–10, remaining flat.
- Highest accuracy across all k values.
2. **L (Orange ▲)**:
- Begins at ~35% for k=2.
- Increases steadily to ~60% for k=10.
- Consistent upward trend.
3. **M (Green ■)**:
- Starts at ~20% for k=2.
- Rises to ~40% for k=10.
- Gradual, linear growth.
4. **S (Red ◆)**:
- Begins at ~15% for k=2.
- Reaches ~35% for k=10.
- Steady but slower growth than M.
5. **XS (Purple ●)**:
- Starts at ~10% for k=2.
- Ends at ~18% for k=10.
- Minimal improvement, nearly flat.
### Key Observations
- **Model Size Correlation**: Larger models (IT, L) achieve higher accuracy than smaller ones (XS).
- **Token Sensitivity**: All models improve accuracy as k increases, but the rate of improvement diminishes for larger models (e.g., IT plateaus at k=4).
- **Performance Gaps**: IT outperforms others by ~40% at k=10, while XS lags by ~42%.
### Interpretation
The data suggests that model size and token selection significantly impact decoding accuracy. Larger models (IT, L) leverage more tokens effectively, achieving near-saturation accuracy (IT at 80%), while smaller models (XS) show limited gains. The diminishing returns for IT at k≥4 imply that increasing token diversity beyond a threshold offers minimal benefits for high-capacity models. This highlights a trade-off between computational cost (larger k) and accuracy gains, with diminishing returns for resource-intensive models.