\n
## Bar Chart: Model Accuracy Comparison
### Overview
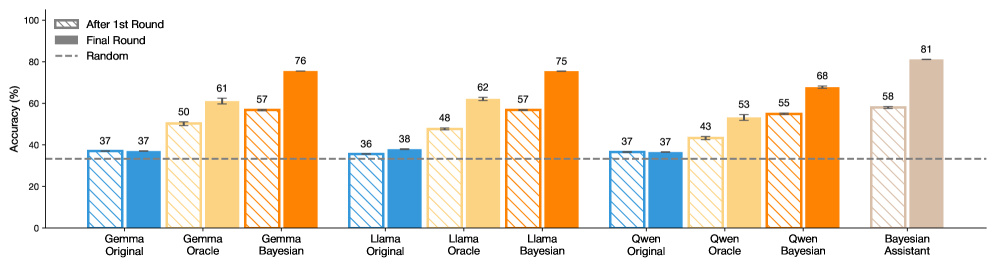
This bar chart compares the accuracy of several models (Gemma Original, Gemma Bayesian, Llama Original, Llama Oracle, Llama Bayesian, Owen Original, Owen Oracle, Owen Bayesian, and Bayesian Assistant) across two rounds of evaluation: "After 1st Round" and "Final Round". A horizontal dashed line represents the accuracy of a "Random" baseline. Error bars are present for each data point, indicating the uncertainty in the accuracy measurement.
### Components/Axes
* **X-axis:** Model Name (Gemma Original, Gemma Bayesian, Llama Original, Llama Oracle, Llama Bayesian, Owen Original, Owen Oracle, Owen Bayesian, Bayesian Assistant)
* **Y-axis:** Accuracy (%) - Scale ranges from 0 to 100.
* **Legend:**
* Blue: "After 1st Round"
* Orange: "Final Round"
* Gray: "Random" (represented as a dashed horizontal line)
* **Error Bars:** Vertical lines extending above and below each bar, representing the standard error or confidence interval.
### Detailed Analysis
The chart consists of nine groups of bars, one for each model. Each group contains two bars representing the accuracy in the "After 1st Round" and "Final Round". The "Random" baseline is a horizontal dashed line at approximately 37% accuracy.
Here's a breakdown of the accuracy values, with approximate values and uncertainties based on the error bars:
* **Gemma Original:**
* After 1st Round: Approximately 37% ± 2%
* Final Round: Approximately 50% ± 3%
* **Gemma Bayesian:**
* After 1st Round: Approximately 61% ± 3%
* Final Round: Approximately 76% ± 3%
* **Llama Original:**
* After 1st Round: Approximately 36% ± 2%
* Final Round: Approximately 38% ± 2%
* **Llama Oracle:**
* After 1st Round: Approximately 48% ± 3%
* Final Round: Approximately 62% ± 3%
* **Llama Bayesian:**
* After 1st Round: Approximately 57% ± 3%
* Final Round: Approximately 75% ± 3%
* **Owen Original:**
* After 1st Round: Approximately 37% ± 2%
* Final Round: Approximately 43% ± 3%
* **Owen Oracle:**
* After 1st Round: Approximately 53% ± 3%
* Final Round: Approximately 55% ± 3%
* **Owen Bayesian:**
* After 1st Round: Approximately 68% ± 3%
* Final Round: Approximately 55% ± 3%
* **Bayesian Assistant:**
* After 1st Round: Approximately 58% ± 3%
* Final Round: Approximately 81% ± 3%
**Trends:**
* For most models, the accuracy increases from the "After 1st Round" to the "Final Round".
* The "Bayesian Assistant" model demonstrates the highest accuracy in the "Final Round", significantly exceeding the other models.
* "Llama Original" shows minimal improvement between the two rounds.
* "Owen Bayesian" shows a decrease in accuracy from the first to the final round.
### Key Observations
* The "Bayesian Assistant" model significantly outperforms all other models in the "Final Round".
* The "Llama Original" model shows very little improvement between the first and final rounds, remaining close to the "Random" baseline.
* The "Owen Bayesian" model is an outlier, showing a decrease in accuracy in the final round.
* The "Random" baseline is consistently below the accuracy of most models in the "Final Round", indicating that the models are generally performing better than random chance.
### Interpretation
The data suggests that iterative refinement ("Final Round" vs. "After 1st Round") generally improves model accuracy. The Bayesian approaches (Gemma Bayesian, Llama Bayesian, Owen Bayesian, and Bayesian Assistant) consistently show higher accuracy than their non-Bayesian counterparts. The "Bayesian Assistant" model's exceptional performance in the "Final Round" indicates that this approach, when fully refined, can achieve significantly higher accuracy than other models tested. The lack of improvement in "Llama Original" suggests that this model may have reached its performance limit or requires a different optimization strategy. The decrease in accuracy for "Owen Bayesian" is an anomaly that warrants further investigation – it could be due to overfitting, a bug in the training process, or other unforeseen factors. The consistent performance above the random baseline indicates that all models, to some degree, are learning and making predictions better than chance. The error bars indicate the uncertainty in these measurements, and it's important to consider these when comparing the performance of different models.