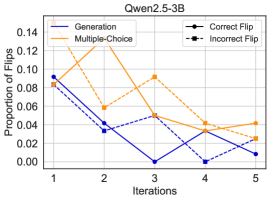
## Line Chart: Proportion of Flips Across Iterations for Qwen2.5-3B
### Overview
The chart visualizes the proportion of flips (correct and incorrect) for two strategies—**Generation** (blue line) and **Multiple-Choice** (orange line)—across five iterations. The y-axis represents the proportion of flips (0.00 to 0.14), while the x-axis denotes iterations (1 to 5). Two markers indicate "Correct Flip" (solid black) and "Incorrect Flip" (dashed black), placed on specific data points.
---
### Components/Axes
- **X-axis (Iterations)**: Labeled "Iterations," with discrete values 1 to 5.
- **Y-axis (Proportion of Flips)**: Labeled "Proportion of Flips," scaled from 0.00 to 0.14 in increments of 0.02.
- **Legend**: Located in the top-right corner, with four entries:
- **Generation**: Blue solid line.
- **Multiple-Choice**: Orange dashed line.
- **Correct Flip**: Solid black marker.
- **Incorrect Flip**: Dashed black marker.
---
### Detailed Analysis
#### Generation (Blue Line)
- **Trend**: Starts at ~0.09 (iteration 1), drops sharply to ~0.04 (iteration 2), plummets to ~0.00 (iteration 3), rises slightly to ~0.03 (iteration 4), and ends at ~0.01 (iteration 5).
- **Markers**:
- **Correct Flip** (solid black): Placed at iteration 1 (~0.09).
- No other markers observed.
#### Multiple-Choice (Orange Line)
- **Trend**: Begins at ~0.08 (iteration 1), peaks at ~0.14 (iteration 2), declines to ~0.06 (iteration 3), then ~0.04 (iteration 4), and ends at ~0.03 (iteration 5).
- **Markers**:
- **Incorrect Flip** (dashed black): Placed at iteration 2 (~0.14).
---
### Key Observations
1. **Generation Strategy**:
- Shows a steep decline in flip proportion from iteration 1 to 3, suggesting reduced variability or improved stability.
- A minor rebound in iterations 4–5, but remains near-zero.
2. **Multiple-Choice Strategy**:
- Exhibits a sharp peak at iteration 2 (~0.14), followed by a consistent decline.
- The **Incorrect Flip** marker at iteration 2 aligns with the peak, indicating a high proportion of incorrect flips at this point.
3. **Marker Placement**:
- The **Correct Flip** (iteration 1, Generation) and **Incorrect Flip** (iteration 2, Multiple-Choice) are spatially distinct, highlighting divergent performance at early iterations.
---
### Interpretation
- **Strategy Performance**:
- The **Generation** strategy demonstrates a rapid reduction in flip proportion, potentially indicating improved accuracy or confidence over iterations.
- The **Multiple-Choice** strategy starts with high flip rates but declines sharply, with the **Incorrect Flip** marker suggesting a critical error or outlier at iteration 2.
- **Trend Implications**:
- The divergence between the two strategies (Generation’s decline vs. Multiple-Choice’s peak) may reflect differing approaches to answer selection or error correction.
- The near-zero flip proportion for Generation after iteration 3 could imply stabilization or convergence to a correct answer.
- **Anomalies**:
- The **Incorrect Flip** marker at iteration 2 for Multiple-Choice coincides with its peak, raising questions about whether this represents a systemic issue or a one-time error.
---
### Spatial Grounding
- **Legend**: Top-right corner, clearly associating colors/markers with strategies and flip types.
- **Markers**:
- Solid black (Correct Flip) at iteration 1 (Generation line).
- Dashed black (Incorrect Flip) at iteration 2 (Multiple-Choice line).
- **Axes**: Y-axis on the left, X-axis at the bottom, with gridlines for reference.
---
### Content Details
- **Numerical Approximations** (with uncertainty):
- **Generation**:
- Iteration 1: ~0.09
- Iteration 2: ~0.04
- Iteration 3: ~0.00
- Iteration 4: ~0.03
- Iteration 5: ~0.01
- **Multiple-Choice**:
- Iteration 1: ~0.08
- Iteration 2: ~0.14
- Iteration 3: ~0.06
- Iteration 4: ~0.04
- Iteration 5: ~0.03
---
### Final Notes
The chart highlights contrasting trajectories for the two strategies, with the **Generation** approach showing a more stable decline and the **Multiple-Choice** strategy exhibiting volatility. The markers provide critical context for specific flip events, suggesting areas for further investigation into error patterns.