## Line Chart: Proportion of Flips vs. Iterations (Qwen2.5-3B)
### Overview
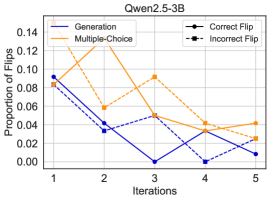
This line chart depicts the proportion of flips across different iterations for various methods: Generation, Multiple-Choice, Correct Flip, and Incorrect Flip. The chart appears to be evaluating the performance of a model (Qwen2.5-3B) over several iterations, likely in a training or evaluation context.
### Components/Axes
* **Title:** Qwen2.5-3B (top-center)
* **X-axis:** Iterations (labeled 1 to 5, evenly spaced)
* **Y-axis:** Proportion of Flips (scale from 0.00 to 0.14, evenly spaced)
* **Legend:** Located in the top-right corner.
* Generation (solid blue line)
* Multiple-Choice (solid orange line)
* Correct Flip (solid black line with circle markers)
* Incorrect Flip (dashed blue line with diamond markers)
### Detailed Analysis
Let's analyze each data series:
* **Generation (Blue Solid Line):** The line slopes downward from Iteration 1 to Iteration 3, then fluctuates.
* Iteration 1: Approximately 0.09
* Iteration 2: Approximately 0.035
* Iteration 3: Approximately 0.01
* Iteration 4: Approximately 0.002
* Iteration 5: Approximately 0.02
* **Multiple-Choice (Orange Solid Line):** The line initially increases, peaks at Iteration 2, and then decreases.
* Iteration 1: Approximately 0.06
* Iteration 2: Approximately 0.125
* Iteration 3: Approximately 0.09
* Iteration 4: Approximately 0.03
* Iteration 5: Approximately 0.03
* **Correct Flip (Black Solid Line with Circle Markers):** The line generally decreases, with some fluctuations.
* Iteration 1: Approximately 0.085
* Iteration 2: Approximately 0.06
* Iteration 3: Approximately 0.045
* Iteration 4: Approximately 0.03
* Iteration 5: Approximately 0.025
* **Incorrect Flip (Dashed Blue Line with Diamond Markers):** The line fluctuates with a general downward trend.
* Iteration 1: Approximately 0.045
* Iteration 2: Approximately 0.04
* Iteration 3: Approximately 0.05
* Iteration 4: Approximately 0.015
* Iteration 5: Approximately 0.025
### Key Observations
* The "Generation" method shows a significant decrease in the proportion of flips from Iteration 1 to Iteration 3, suggesting improvement or convergence.
* The "Multiple-Choice" method exhibits a peak at Iteration 2, indicating a potential point of interest or instability.
* "Correct Flip" and "Incorrect Flip" both show a decreasing trend, but "Incorrect Flip" remains relatively higher than "Correct Flip" throughout the iterations.
* The "Generation" and "Incorrect Flip" lines converge towards the end of the iterations.
### Interpretation
The chart likely represents the evaluation of a language model (Qwen2.5-3B) during a training or fine-tuning process. "Flips" could refer to changes in model parameters or predictions. The different methods ("Generation," "Multiple-Choice") likely represent different training or evaluation strategies.
The decreasing trend in "Generation" and "Correct Flip" suggests that the model is becoming more stable and accurate over iterations. The peak in "Multiple-Choice" at Iteration 2 might indicate a temporary increase in uncertainty or a specific challenge encountered during that iteration. The fact that "Incorrect Flip" remains higher than "Correct Flip" suggests that the model still makes errors, but the overall error rate is decreasing.
The convergence of "Generation" and "Incorrect Flip" towards the end of the iterations could indicate that the model is approaching a point where it is less likely to make significant changes to its predictions. This could be a sign of convergence or overfitting. Further analysis would be needed to determine the optimal stopping point for training.