## Line Chart: Qwen2.5-3B
### Overview
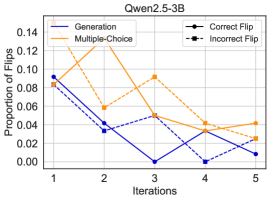
The image displays a line chart titled "Qwen2.5-3B," plotting the "Proportion of Flips" against "Iterations" for four distinct data series. The chart compares the performance or behavior of different methods or conditions over a sequence of five iterations.
### Components/Axes
* **Chart Title:** Qwen2.5-3B (positioned at the top center).
* **X-Axis:** Labeled "Iterations." It has discrete markers at integer values from 1 to 5.
* **Y-Axis:** Labeled "Proportion of Flips." The scale ranges from 0.00 to 0.14, with major tick marks at intervals of 0.02 (0.00, 0.02, 0.04, 0.06, 0.08, 0.10, 0.12, 0.14).
* **Legend:** Positioned in the top-right corner of the plot area. It defines four series:
1. **Generation:** Solid blue line.
2. **Multiple-Choice:** Solid orange line.
3. **Correct Flip:** Dashed blue line with circular markers.
4. **Incorrect Flip:** Dashed orange line with square markers.
### Detailed Analysis
**Data Series and Approximate Values:**
1. **Generation (Solid Blue Line):**
* Trend: Overall downward trend with a slight recovery at the end.
* Iteration 1: ~0.08
* Iteration 2: ~0.04
* Iteration 3: ~0.00
* Iteration 4: ~0.04
* Iteration 5: ~0.02
2. **Multiple-Choice (Solid Orange Line):**
* Trend: Fluctuates, with a notable peak at iteration 3.
* Iteration 1: ~0.10
* Iteration 2: ~0.06
* Iteration 3: ~0.10
* Iteration 4: ~0.04
* Iteration 5: ~0.05
3. **Correct Flip (Dashed Blue Line with Circles):**
* Trend: Decreases initially, rises slightly, drops to zero, then recovers.
* Iteration 1: ~0.09
* Iteration 2: ~0.04
* Iteration 3: ~0.05
* Iteration 4: ~0.00
* Iteration 5: ~0.03
4. **Incorrect Flip (Dashed Orange Line with Squares):**
* Trend: Rises to a peak at iteration 3, then declines.
* Iteration 1: ~0.08
* Iteration 2: ~0.06
* Iteration 3: ~0.09
* Iteration 4: ~0.04
* Iteration 5: ~0.04
### Key Observations
* **Peak at Iteration 3:** Both the "Multiple-Choice" and "Incorrect Flip" series reach their highest values at iteration 3.
* **Zero Value:** The "Correct Flip" series drops to exactly 0.00 at iteration 4.
* **Convergence at Iteration 4:** At iteration 4, three of the four series ("Generation," "Multiple-Choice," and "Incorrect Flip") converge at approximately 0.04.
* **Divergence at Start:** At iteration 1, the "Multiple-Choice" proportion (~0.10) is the highest, while the "Generation" proportion (~0.08) is the lowest among the four series.
* **Final Values:** By iteration 5, all series have proportion values between 0.02 and 0.05, showing less spread than at earlier iterations.
### Interpretation
The chart appears to track the rate of "flips" (likely a change in model output, prediction, or state) across iterations for a model or system named Qwen2.5-3B. The data suggests:
1. **Method Comparison:** The "Multiple-Choice" condition generally exhibits a higher proportion of flips than the "Generation" condition, especially in the first three iterations. This could indicate that the multiple-choice setting is more volatile or responsive to iterative changes.
2. **Flip Quality:** The "Correct Flip" and "Incorrect Flip" series likely break down the "flips" into successful and unsuccessful changes. The peak in "Incorrect Flip" at iteration 3 coinciding with the peak in "Multiple-Choice" suggests that the increased activity in the multiple-choice method at that stage may have led to a higher rate of erroneous changes.
3. **Process Dynamics:** The system shows significant activity in the early iterations (1-3), with a notable event or shift occurring at iteration 3 (peaks) and iteration 4 (convergence and a zero correct flip rate). This pattern could reflect a learning curve, an optimization process, or a phased evaluation where the system stabilizes or encounters a specific challenge in the middle iterations.
4. **Overall Trend:** Despite the fluctuations, the general trend for all series is toward lower flip proportions by iteration 5, which may indicate the system is reaching a more stable state or that the potential for change diminishes over time.