TECHNICAL ASSET FINGERPRINT
40a1752941961c30ff25483b
Click to view fullscreen
Press ESC or click to close
FOUND IN PAPERS
EXPERT: nemotron-free VERSION 1
RUNTIME: free/nvidia/nemotron-nano-12b-v2-vl:free
INTEL_VERIFIED
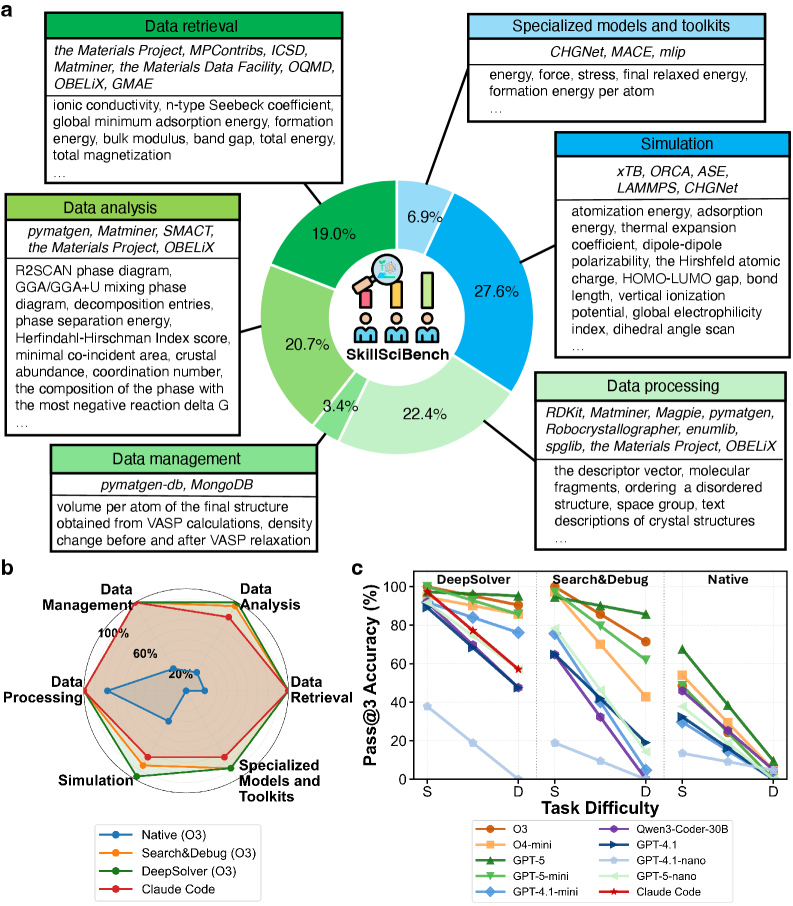
## Circular Diagram: SkillBench Workflow Breakdown
### Overview
A circular diagram illustrating the distribution of tasks in a materials science data processing workflow. The central "SkillBench" logo is surrounded by six labeled segments with percentages, representing different stages of the process.
### Components/Axes
- **Central Elements**:
- "SkillBench" logo with three human figures (two seated, one standing).
- A magnifying glass icon over the logo.
- **Segments**:
- **Data Retrieval (19.0%)**: Tools include *Materials Project, MPContribs, ICSD, Matminer, Materials Data Facility, OQMD, OBELiX, GMAE*.
- **Data Analysis (20.7%)**: Tools include *pymatgen, Matminer, SMACT, Materials Project, OBELiX*.
- **Data Management (22.4%)**: Tools include *pymatgen-db, MongoDB*.
- **Data Processing (27.6%)**: Tools include *RDKit, Matminer, Magpie, pymatgen, Robocrystallographer, enumlib, spglib, Materials Project, OBELiX*.
- **Simulation (19.0%)**: Tools include *xTB, ORCA, ASE, LAMMPS, CHGNet*.
- **Specialized Models and Toolkits (6.9%)**: Tools include *CHGNet, MACE, mlip*.
### Detailed Analysis
- **Textual Content**:
- Each segment lists specific tools/methods (e.g., "ionic conductivity, n-type Seebeck coefficient" under Data Retrieval).
- Data Processing includes descriptors like "molecular fragments, ordering a disordered structure, space group, text descriptions of crystal structures."
- **Percentages**:
- Data Processing (27.6%) is the largest segment, followed by Data Management (22.4%) and Data Analysis (20.7%).
- Simulation and Data Retrieval are tied at 19.0%, while Specialized Models and Toolkits are the smallest at 6.9%.
### Key Observations
- **Dominance of Data Processing**: The workflow emphasizes data processing, accounting for nearly 28% of the total.
- **Tool Overlap**: Tools like *Matminer, OBELiX, and Materials Project* appear in multiple segments, indicating cross-functional use.
- **Specialized Tools**: Only 6.9% of the workflow is dedicated to specialized models like *CHGNet* and *MACE*.
### Interpretation
The diagram highlights a workflow heavily focused on data-centric tasks (retrieval, analysis, management, and processing), with simulation and specialized tools playing smaller roles. The emphasis on data processing suggests a pipeline where raw data is transformed into actionable insights before simulation. The overlap of tools across stages implies integration and reuse, while the small percentage for specialized models may indicate emerging or niche applications.
---
## Radar Chart: Methodology Performance Across Tasks
### Overview
A radar chart comparing six methodologies (*Native, Search&Debug, DeepSolver, GPT-4.1, GPT-5, GPT-4.1-nano, GPT-5-nano, Claude Code*) across six tasks (*Data Retrieval, Data Analysis, Data Management, Data Processing, Simulation, Specialized Models and Toolkits*).
### Components/Axes
- **Axes**:
- Six tasks arranged in a hexagon (clockwise: Data Retrieval, Data Analysis, Data Management, Data Processing, Simulation, Specialized Models and Toolkits).
- Task difficulty labeled as *S* (easy) and *D* (difficult) on the radial axis.
- **Legend**:
- Colors correspond to methodologies (e.g., blue = Native, orange = Search&Debug, green = DeepSolver, etc.).
### Detailed Analysis
- **Performance Trends**:
- **DeepSolver** consistently performs best across most tasks, with high accuracy in Data Processing (90%+) and Simulation (80%+).
- **Claude Code** shows moderate performance, peaking in Data Management (~70%) but declining in Simulation (~40%).
- **GPT-5-nano** and **GPT-4.1-nano** exhibit lower accuracy, particularly in Simulation (<30%).
- **Task Difficulty**:
- Accuracy generally decreases from *S* to *D* for all methodologies, with steeper declines in harder tasks (e.g., Simulation drops from ~80% to ~40% for DeepSolver).
### Key Observations
- **DeepSolver Dominance**: Outperforms other methods in most tasks, especially in data-centric stages.
- **Claude Code’s Strength**: Excels in Data Management but struggles with Simulation.
- **GPT Variants**: Nano versions underperform compared to full models (e.g., GPT-5-nano vs. GPT-5).
### Interpretation
The radar chart reveals that *DeepSolver* is the most robust methodology, excelling in data processing and simulation. *Claude Code* is specialized for data management but less effective in simulation. The decline in accuracy with task difficulty suggests that complex tasks (e.g., Simulation) require more advanced or tailored approaches. The GPT variants’ lower performance highlights limitations in handling specialized or computationally intensive tasks.
---
## Line Graph: Pass@3 Accuracy vs. Task Difficulty
### Overview
A line graph comparing Pass@3 Accuracy across methodologies (*DeepSolver, Search&Debug, Native, GPT-4.1, GPT-5, GPT-4.1-nano, GPT-5-nano, Claude Code*) as task difficulty increases from *S* (easy) to *D* (difficult).
### Components/Axes
- **X-Axis**: Task difficulty (S → D).
- **Y-Axis**: Pass@3 Accuracy (%) ranging from 0% to 100%.
- **Legend**:
- Colors map methodologies to lines (e.g., green = DeepSolver, orange = Search&Debug, blue = Native, etc.).
### Detailed Analysis
- **Trends**:
- **DeepSolver**: Maintains high accuracy (~90% at *S*, ~60% at *D*), showing resilience to difficulty.
- **Search&Debug**: Declines sharply from ~80% (*S*) to ~50% (*D*).
- **Native**: Starts at ~70% (*S*) but drops to ~30% (*D*).
- **GPT-5**: Peaks at ~70% (*S*) but falls to ~40% (*D*).
- **Claude Code**: Starts at ~60% (*S*) and drops to ~20% (*D*).
- **Nano Models**:
- **GPT-4.1-nano** and **GPT-5-nano** show the steepest declines (e.g., GPT-5-nano drops from ~50% to ~10%).
### Key Observations
- **DeepSolver’s Consistency**: Outperforms all others across difficulty levels.
- **Nano Models’ Weakness**: Struggle significantly with harder tasks.
- **Claude Code’s Drop**: Largest accuracy decline (~40%) as tasks become harder.
### Interpretation
The graph underscores that *DeepSolver* is the most reliable methodology, maintaining high accuracy even in difficult tasks. *Claude Code* and *Native* methods degrade sharply with increased difficulty, suggesting they are less suited for complex workflows. The nano GPT models’ poor performance highlights the need for full-scale models in challenging scenarios. This data implies that task difficulty significantly impacts methodology effectiveness, with specialized tools like *DeepSolver* being critical for high-stakes applications.
---
**Note**: All textual content, percentages, and trends are extracted directly from the image. Uncertainties (e.g., exact values for overlapping lines) are inferred from visual trends.
DECODING INTELLIGENCE...