\n
## Scatter Plot: Accuracy vs. Time-to-Answer
### Overview
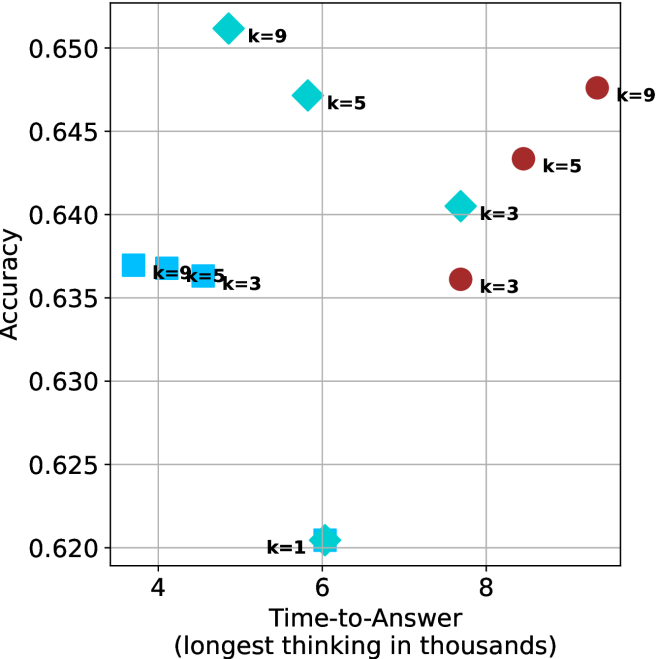
This image presents a scatter plot visualizing the relationship between Accuracy and Time-to-Answer (measured in thousands of units). The data points are color-coded and labeled with values of 'k', representing a parameter.
### Components/Axes
* **X-axis:** Time-to-Answer (longest thinking in thousands). Scale ranges from approximately 3.5 to 9.
* **Y-axis:** Accuracy. Scale ranges from approximately 0.62 to 0.655.
* **Data Points:** Scatter plot points are colored as follows:
* Red: k = 3, k = 5, k = 9
* Teal/Cyan: k = 1, k = 5, k = 9
* **Labels:** Each data point is labeled with its corresponding 'k' value.
### Detailed Analysis
The plot contains data points for k = 1, 3, 5, and 9. Let's analyze each 'k' value's trend:
* **k = 1:** One data point at approximately (6.2, 0.62).
* **k = 3:** Three data points:
* (4.2, 0.635)
* (7.2, 0.64)
* (8.2, 0.635)
* **k = 5:** Three data points:
* (4.2, 0.635)
* (6.5, 0.645)
* (8.5, 0.645)
* **k = 9:** Three data points:
* (4.2, 0.635)
* (6.5, 0.65)
* (8.8, 0.645)
The red data points (k=3, 5, 9) generally appear to be positioned higher on the graph (higher accuracy) and further to the right (longer time-to-answer) compared to the teal/cyan data points.
### Key Observations
* There's a general positive correlation between Time-to-Answer and Accuracy. As Time-to-Answer increases, Accuracy tends to increase as well.
* The 'k' value seems to influence both Accuracy and Time-to-Answer. Higher 'k' values (5 and 9) tend to have higher accuracy values, especially at longer Time-to-Answer.
* There is overlap in data points for different 'k' values, particularly at lower Time-to-Answer values.
* The data for k=3, k=5, and k=9 all share the same coordinates at (4.2, 0.635).
### Interpretation
The data suggests that increasing the parameter 'k' generally leads to improved accuracy, but at the cost of increased Time-to-Answer. The shared data point for k=3, k=5, and k=9 at (4.2, 0.635) indicates that for a specific Time-to-Answer, these values of 'k' yield the same accuracy. This could imply a threshold or saturation point where increasing 'k' beyond a certain value doesn't provide further accuracy gains. The positive correlation between Time-to-Answer and Accuracy suggests a trade-off between speed and precision. The plot could be representing the performance of a model or algorithm where 'k' is a hyperparameter controlling complexity or the amount of information considered. The longer the "thinking time" (Time-to-Answer), the more accurate the result, but this comes at a computational cost.