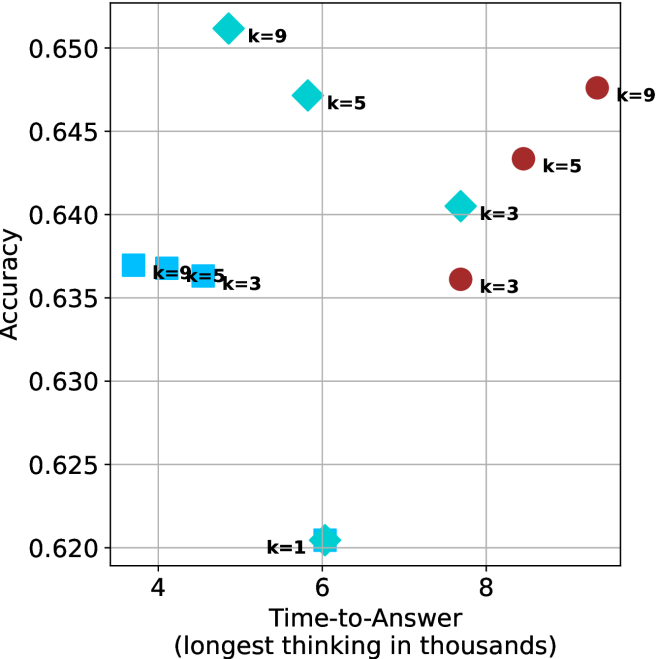
## Scatter Plot: Accuracy vs. Time-to-Answer for Different k Values
### Overview
The image is a scatter plot comparing **accuracy** (y-axis) and **time-to-answer** (x-axis, in thousands of units) for three distinct values of a parameter `k` (k=3, k=5, k=9). Data points are color-coded and shaped uniquely per `k` value, with a legend on the right. The plot reveals trends in how accuracy and decision time vary with `k`.
---
### Components/Axes
- **X-axis (Time-to-Answer)**: Labeled "Time-to-Answer (longest thinking in thousands)", scaled from 4 to 9 in increments of 1.
- **Y-axis (Accuracy)**: Labeled "Accuracy", scaled from 0.620 to 0.650 in increments of 0.005.
- **Legend**: Located on the right, with three entries:
- **k=3**: Blue squares (`□`)
- **k=5**: Green diamonds (`◇`)
- **k=9**: Red circles (`●`)
- **Gridlines**: Horizontal and vertical lines at axis intervals for reference.
---
### Detailed Analysis
#### Data Points by `k` Value
1. **k=3 (Blue Squares)**:
- (4, 0.635)
- (5, 0.635)
- (6, 0.620)
- (8, 0.640)
- (9, 0.635)
- **Trend**: Accuracy fluctuates between 0.620 and 0.640, with no clear upward/downward pattern. Time-to-answer ranges from 4 to 9.
2. **k=5 (Green Diamonds)**:
- (5, 0.645)
- (6, 0.640)
- (8, 0.645)
- (9, 0.645)
- **Trend**: Consistently high accuracy (0.640–0.645) across time-to-answer values 5–9. Slight clustering at higher time values.
3. **k=9 (Red Circles)**:
- (4, 0.650)
- (5, 0.645)
- (9, 0.645)
- **Trend**: Highest accuracy (0.645–0.650) but limited to time-to-answer values 4–5 and 9. A notable outlier at (4, 0.650) shows peak accuracy with minimal time.
---
### Key Observations
1. **Accuracy vs. `k`**:
- `k=9` achieves the highest accuracy (0.650), followed by `k=5` (0.645) and `k=3` (0.635–0.640).
- Higher `k` values generally correlate with higher accuracy, but variability exists (e.g., `k=9` at time=9 has lower accuracy than at time=4).
2. **Time-to-Answer vs. `k`**:
- `k=3` spans the widest time range (4–9), suggesting slower decision-making for lower `k`.
- `k=9` has the shortest time-to-answer (4–5) for its highest accuracy, indicating efficiency at optimal `k`.
3. **Outliers**:
- The `k=9` point at (4, 0.650) stands out as the highest accuracy with the shortest time, suggesting an optimal trade-off for this `k` value.
---
### Interpretation
- **Trade-off Analysis**: Increasing `k` improves accuracy but may not linearly affect time-to-answer. For example, `k=9` achieves peak accuracy at time=4 but reverts to lower accuracy at time=9, implying diminishing returns or contextual dependencies.
- **Efficiency Insight**: `k=9` at time=4 represents an ideal balance of high accuracy and minimal time, though its performance degrades at longer times.
- **Anomalies**: The `k=3` point at (6, 0.620) is the lowest accuracy, potentially indicating suboptimal performance for this `k` value at mid-range time.
This plot highlights the importance of selecting `k` based on the desired balance between accuracy and computational efficiency, with `k=9` showing promise for high-stakes, time-sensitive applications.