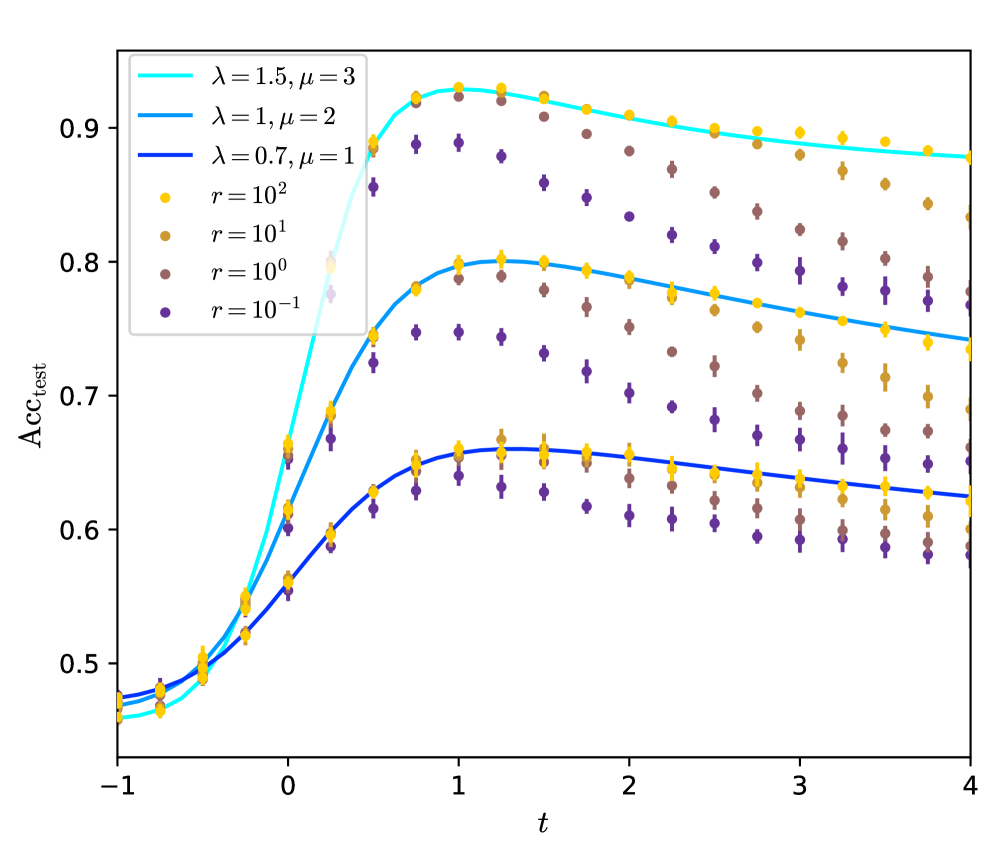
## Chart: Accuracy vs. Time for Different Parameters
### Overview
The image is a line chart showing the test accuracy (Acc_test) as a function of time (t) for different values of parameters lambda (λ), mu (μ), and r. There are three lines representing different combinations of λ and μ, and four sets of scattered points representing different values of r.
### Components/Axes
* **X-axis:** Time (t), ranging from -1 to 4. Axis markers are present at -1, 0, 1, 2, 3, and 4.
* **Y-axis:** Test Accuracy (Acc_test), ranging from 0.5 to 0.9. Axis markers are present at 0.5, 0.6, 0.7, 0.8, and 0.9.
* **Legend (Top-Left):**
* Cyan line: λ = 1.5, μ = 3
* Dark Blue line: λ = 1, μ = 2
* Blue line: λ = 0.7, μ = 1
* Yellow points: r = 10^2
* Brown points: r = 10^1
* Gray points: r = 10^0
* Purple points: r = 10^-1
### Detailed Analysis
**Line Data (λ and μ parameters):**
* **Cyan Line (λ = 1.5, μ = 3):** The line starts at approximately 0.48 at t = -1, increases rapidly to a peak of approximately 0.93 at t = 1, and then gradually decreases to approximately 0.88 at t = 4.
* t = -1, Acc_test ≈ 0.48
* t = 0, Acc_test ≈ 0.68
* t = 1, Acc_test ≈ 0.93
* t = 2, Acc_test ≈ 0.92
* t = 3, Acc_test ≈ 0.90
* t = 4, Acc_test ≈ 0.88
* **Dark Blue Line (λ = 1, μ = 2):** The line starts at approximately 0.48 at t = -1, increases rapidly to a peak of approximately 0.80 at t = 1, and then gradually decreases to approximately 0.75 at t = 4.
* t = -1, Acc_test ≈ 0.48
* t = 0, Acc_test ≈ 0.60
* t = 1, Acc_test ≈ 0.80
* t = 2, Acc_test ≈ 0.79
* t = 3, Acc_test ≈ 0.77
* t = 4, Acc_test ≈ 0.75
* **Blue Line (λ = 0.7, μ = 1):** The line starts at approximately 0.48 at t = -1, increases rapidly to a peak of approximately 0.65 at t = 1, and then gradually decreases to approximately 0.62 at t = 4.
* t = -1, Acc_test ≈ 0.48
* t = 0, Acc_test ≈ 0.55
* t = 1, Acc_test ≈ 0.65
* t = 2, Acc_test ≈ 0.64
* t = 3, Acc_test ≈ 0.63
* t = 4, Acc_test ≈ 0.62
**Scatter Plot Data (r parameter):**
* **Yellow Points (r = 10^2):** The points generally follow a similar trend to the lines, starting low, increasing to a peak, and then decreasing. The accuracy values are generally higher than the other 'r' values.
* At t = -1, Acc_test ≈ 0.48
* At t = 0, Acc_test ≈ 0.68
* At t = 1, Acc_test ≈ 0.80
* At t = 2, Acc_test ≈ 0.82
* At t = 3, Acc_test ≈ 0.80
* At t = 4, Acc_test ≈ 0.85
* **Brown Points (r = 10^1):** The points generally follow a similar trend to the lines, starting low, increasing to a peak, and then decreasing.
* At t = -1, Acc_test ≈ 0.48
* At t = 0, Acc_test ≈ 0.60
* At t = 1, Acc_test ≈ 0.72
* At t = 2, Acc_test ≈ 0.75
* At t = 3, Acc_test ≈ 0.73
* At t = 4, Acc_test ≈ 0.78
* **Gray Points (r = 10^0):** The points generally follow a similar trend to the lines, starting low, increasing to a peak, and then decreasing.
* At t = -1, Acc_test ≈ 0.48
* At t = 0, Acc_test ≈ 0.55
* At t = 1, Acc_test ≈ 0.65
* At t = 2, Acc_test ≈ 0.70
* At t = 3, Acc_test ≈ 0.68
* At t = 4, Acc_test ≈ 0.75
* **Purple Points (r = 10^-1):** The points generally follow a similar trend to the lines, starting low, increasing to a peak, and then decreasing. The accuracy values are generally lower than the other 'r' values.
* At t = -1, Acc_test ≈ 0.48
* At t = 0, Acc_test ≈ 0.50
* At t = 1, Acc_test ≈ 0.60
* At t = 2, Acc_test ≈ 0.65
* At t = 3, Acc_test ≈ 0.63
* At t = 4, Acc_test ≈ 0.70
### Key Observations
* The test accuracy increases rapidly initially and then decreases gradually for all parameter combinations.
* Higher values of λ and μ generally lead to higher test accuracy.
* Higher values of 'r' generally lead to higher test accuracy.
* The lines representing λ and μ appear to be smoothed versions of the scattered data points for different 'r' values.
### Interpretation
The chart demonstrates the impact of different parameters (λ, μ, and r) on the test accuracy of a model over time. The initial rapid increase in accuracy suggests a learning phase, while the subsequent decrease might indicate overfitting or a decay in the model's performance as time progresses. The parameters λ and μ seem to control the overall achievable accuracy, with higher values leading to better performance. The parameter 'r' appears to influence the stability or variance of the accuracy, with higher values potentially leading to more stable and higher accuracy. The scattered points show the underlying data, while the lines represent a smoothed or averaged trend for different λ and μ values.