## Line Chart: Acc_test vs. t with Parameter Variations
### Overview
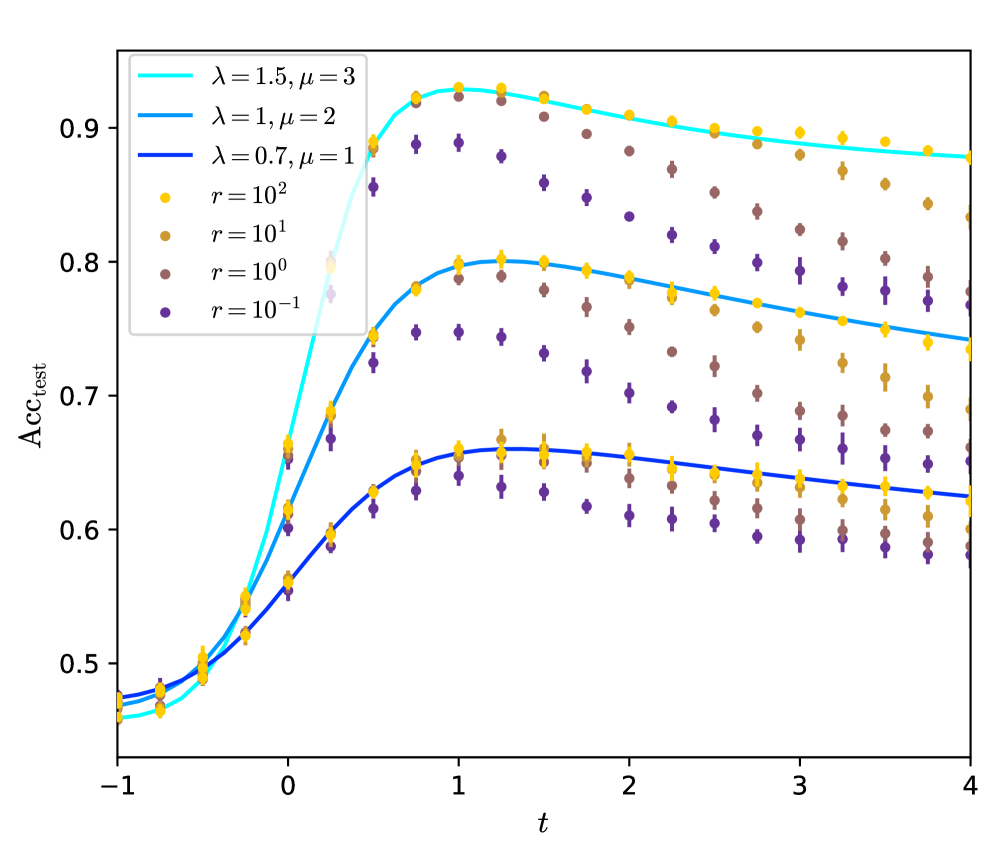
The image presents a line chart illustrating the relationship between `Acc_test` (Accuracy on a test set) and `t` (likely representing time or training steps). The chart compares the performance of different parameter settings, denoted by λ (lambda) and μ (mu), as well as different values of 'r'. The data is presented as multiple lines and scattered points.
### Components/Axes
* **X-axis:** Labeled as `t`, ranging from approximately -1 to 4.
* **Y-axis:** Labeled as `Acc_test`, ranging from approximately 0.48 to 0.92.
* **Lines:** Three lines representing different (λ, μ) parameter combinations:
* λ = 1.5, μ = 3 (Light Blue)
* λ = 1, μ = 2 (Medium Blue)
* λ = 0.7, μ = 1 (Dark Blue)
* **Scatter Points:** Three sets of scatter points representing different 'r' values:
* r = 10<sup>2</sup> (Yellow)
* r = 10<sup>1</sup> (Orange)
* r = 10<sup>-1</sup> (Purple)
* **Legend:** Located in the top-left corner, clearly labeling each line and scatter point series.
### Detailed Analysis
Let's analyze each data series individually:
**Line Series:**
* **λ = 1.5, μ = 3 (Light Blue):** This line starts at approximately ( -1, 0.50) and rapidly increases, reaching a plateau around (1.5, 0.88). It remains relatively stable between approximately 0.86 and 0.90 for t > 1.5.
* **λ = 1, μ = 2 (Medium Blue):** This line begins at approximately (-1, 0.50) and increases more gradually than the light blue line, reaching a plateau around (2, 0.82). It fluctuates between approximately 0.78 and 0.84 for t > 2.
* **λ = 0.7, μ = 1 (Dark Blue):** This line starts at approximately (-1, 0.50) and exhibits the slowest increase, reaching a plateau around (3, 0.68). It remains relatively stable between approximately 0.64 and 0.72 for t > 3.
**Scatter Point Series:**
* **r = 10<sup>2</sup> (Yellow):** These points are scattered, generally trending upwards. Starting around (-1, 0.55), they reach a peak around (3.5, 0.88) and then fluctuate.
* **r = 10<sup>1</sup> (Orange):** These points are also scattered, with a similar upward trend but generally lower values than the yellow points. Starting around (-1, 0.60), they reach a peak around (3.5, 0.80) and then fluctuate.
* **r = 10<sup>-1</sup> (Purple):** These points are scattered, exhibiting a more erratic pattern. They start around (-1, 0.65), reach a peak around (1, 0.85), and then decline, fluctuating between approximately 0.65 and 0.85.
### Key Observations
* The lines representing different (λ, μ) combinations demonstrate that higher values of λ and μ generally lead to faster convergence and higher `Acc_test` values.
* The scatter points for different 'r' values show a general trend of increasing accuracy with increasing 'r', but with significant variability.
* The purple scatter points (r = 10<sup>-1</sup>) exhibit a more unstable behavior, suggesting that very small values of 'r' may lead to less reliable performance.
* All lines start at the same `Acc_test` value at t = -1.
### Interpretation
This chart likely represents the performance of a learning algorithm (or a model) over time (or training iterations). The parameters λ and μ likely control the learning rate or regularization strength of the algorithm. The parameter 'r' could represent the amount of data or the complexity of the model.
The data suggests that:
* Increasing λ and μ can accelerate learning, but may also lead to overfitting or instability if the values are too high.
* Increasing 'r' generally improves performance, but the relationship is not strictly linear and is subject to noise.
* The scatter points represent individual runs or trials, and the variability suggests that the algorithm's performance is sensitive to initial conditions or random factors.
The plateauing of the lines indicates that the algorithm is converging to a stable state. The differences in the plateau levels suggest that different parameter settings lead to different levels of performance. The purple scatter points' erratic behavior could indicate that the model is struggling to learn with a very small 'r' value, potentially due to insufficient data or model capacity. The chart provides valuable insights into the sensitivity of the algorithm's performance to different parameter settings and the importance of choosing appropriate values for λ, μ, and 'r'.