## Line Chart: Accuracy vs. Epochs for Different Methods
### Overview
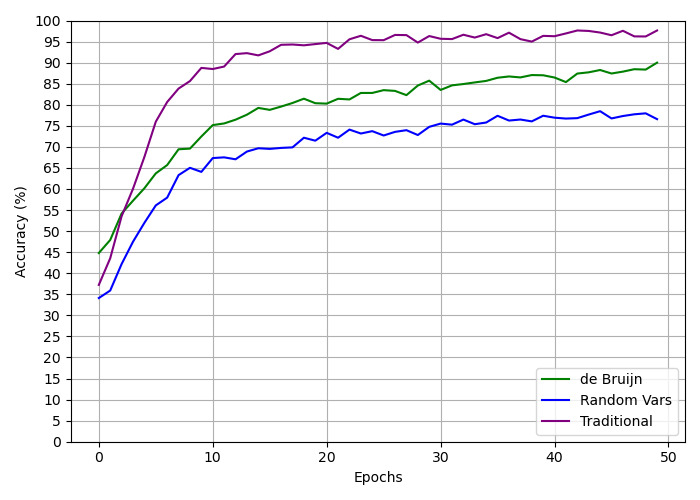
The image is a line chart comparing the accuracy of three different methods ("de Bruijn", "Random Vars", and "Traditional") over 50 epochs. The chart displays accuracy (in percentage) on the y-axis and the number of epochs on the x-axis.
### Components/Axes
* **X-axis:** Epochs, ranging from 0 to 50, with tick marks at intervals of 10.
* **Y-axis:** Accuracy (%), ranging from 0 to 100, with tick marks at intervals of 5.
* **Legend:** Located in the bottom-right corner, it identifies the three methods:
* Green line: "de Bruijn"
* Dark Blue line: "Random Vars"
* Purple line: "Traditional"
### Detailed Analysis
* **"de Bruijn" (Green):** The accuracy increases rapidly from approximately 45% at epoch 0 to around 75% at epoch 10. It then continues to increase, but at a slower rate, reaching approximately 82% at epoch 20, 85% at epoch 30, and finally plateaus around 88-89% at epoch 50.
* **"Random Vars" (Dark Blue):** The accuracy starts at approximately 35% at epoch 0 and increases steadily to about 65% at epoch 10. The rate of increase slows down after epoch 10, reaching approximately 72% at epoch 20, 74% at epoch 30, and plateaus around 77-78% at epoch 50.
* **"Traditional" (Purple):** The accuracy increases sharply from approximately 38% at epoch 0 to about 83% at epoch 10. It continues to increase, but at a slower rate, reaching approximately 93% at epoch 20, 96% at epoch 30, and plateaus around 97% at epoch 50.
### Key Observations
* The "Traditional" method consistently outperforms the other two methods in terms of accuracy across all epochs.
* All three methods show a rapid increase in accuracy during the initial epochs (0-10), followed by a gradual plateauing as the number of epochs increases.
* The "Random Vars" method has the lowest accuracy among the three methods throughout the entire range of epochs.
### Interpretation
The chart demonstrates the performance of three different methods in terms of accuracy over a series of epochs. The "Traditional" method appears to be the most effective, achieving the highest accuracy and plateauing at a higher level compared to the other two methods. The "de Bruijn" method performs better than "Random Vars," but not as well as "Traditional." The plateauing effect suggests that increasing the number of epochs beyond a certain point may not significantly improve the accuracy of any of the methods. The initial rapid increase in accuracy indicates that the models learn quickly in the early stages of training.