\n
## Line Chart: Accuracy vs. Epochs for Different Methods
### Overview
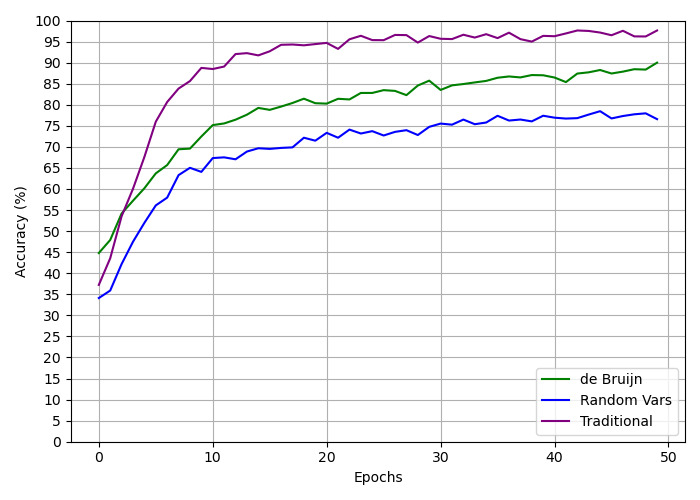
This image presents a line chart illustrating the accuracy of three different methods – de Bruijn, Random Vars, and Traditional – as a function of training epochs. The chart visually compares the performance of each method during the training process.
### Components/Axes
* **X-axis:** Epochs, ranging from 0 to 50.
* **Y-axis:** Accuracy (%), ranging from 5 to 100.
* **Data Series:**
* de Bruijn (Green Line)
* Random Vars (Blue Line)
* Traditional (Purple Line)
* **Legend:** Located at the bottom-right of the chart, identifying each line with its corresponding method name and color.
### Detailed Analysis
The chart displays three distinct lines representing the accuracy of each method over 50 epochs.
* **Traditional (Purple Line):** This line starts at approximately 33% accuracy at epoch 0 and rapidly increases to around 95% accuracy by epoch 10. It then plateaus, fluctuating slightly between 94% and 96% for the remaining epochs.
* **Random Vars (Blue Line):** This line begins at approximately 33% accuracy at epoch 0 and increases more slowly than the Traditional method. It reaches around 72% accuracy by epoch 10 and continues to increase, but at a diminishing rate, reaching approximately 78% accuracy at epoch 50. There is a slight dip in accuracy around epoch 40, falling to approximately 76%.
* **de Bruijn (Green Line):** This line starts at approximately 33% accuracy at epoch 0 and increases steadily, but slower than the Traditional method. It reaches around 83% accuracy by epoch 10 and continues to increase, reaching approximately 90% accuracy at epoch 50.
Here's a more detailed breakdown of approximate accuracy values at specific epochs:
| Epoch | Traditional (%) | Random Vars (%) | de Bruijn (%) |
|-------|-----------------|-----------------|---------------|
| 0 | 33 | 33 | 33 |
| 5 | 65 | 55 | 65 |
| 10 | 95 | 72 | 83 |
| 20 | 96 | 76 | 87 |
| 30 | 95 | 77 | 88 |
| 40 | 95 | 76 | 89 |
| 50 | 96 | 78 | 90 |
### Key Observations
* The Traditional method achieves the highest accuracy and converges quickly, reaching a plateau around 95% accuracy.
* The Random Vars method exhibits the slowest convergence and the lowest overall accuracy.
* The de Bruijn method falls between the Traditional and Random Vars methods in terms of both convergence speed and final accuracy.
* The Random Vars method shows a slight decrease in accuracy around epoch 40, which could indicate overfitting or instability.
### Interpretation
The data suggests that the Traditional method is the most effective for this particular task, achieving high accuracy with relatively few epochs. The de Bruijn method provides a reasonable trade-off between accuracy and convergence speed. The Random Vars method appears to be the least effective, struggling to achieve high accuracy even after 50 epochs.
The rapid convergence of the Traditional method suggests that it is well-suited to the underlying data distribution. The slower convergence of the other methods could be due to a variety of factors, such as a less effective learning algorithm or a more complex data distribution. The dip in accuracy for the Random Vars method around epoch 40 warrants further investigation, as it could indicate a potential issue with the method's stability or generalization ability.
The chart provides a clear visual comparison of the performance of different methods, allowing for informed decisions about which method to use for a given task. The data highlights the importance of selecting an appropriate method based on the specific characteristics of the data and the desired level of accuracy.