## Line Graph: Accuracy vs. Epochs for Different Methods
### Overview
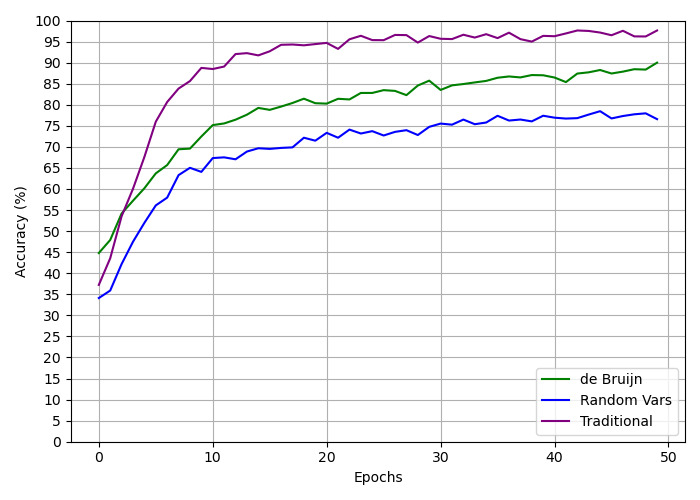
The image is a line graph comparing the accuracy (%) of three methods—**de Bruijn**, **Random Vars**, and **Traditional**—across 50 training epochs. The y-axis represents accuracy (0–100%), and the x-axis represents epochs (0–50). Three colored lines (green, blue, purple) correspond to the methods, with a legend in the bottom-right corner.
---
### Components/Axes
- **X-axis (Epochs)**: Labeled "Epochs," ranging from 0 to 50 in increments of 10.
- **Y-axis (Accuracy %)**: Labeled "Accuracy (%)", ranging from 0 to 100 in increments of 10.
- **Legend**: Located in the bottom-right corner, with three entries:
- **Green**: de Bruijn
- **Blue**: Random Vars
- **Purple**: Traditional
---
### Detailed Analysis
#### Line Trends
1. **Traditional (Purple)**:
- Starts at ~35% accuracy at epoch 0.
- Rises sharply to ~95% by epoch 10.
- Plateaus with minor fluctuations (~95–98%) from epoch 10 to 50.
- **Key Trend**: Rapid initial improvement, then stabilization.
2. **de Bruijn (Green)**:
- Starts at ~45% accuracy at epoch 0.
- Gradually increases to ~90% by epoch 50.
- Shows steady growth with minor dips (e.g., epoch 15–20).
- **Key Trend**: Consistent but slower improvement compared to Traditional.
3. **Random Vars (Blue)**:
- Starts at ~35% accuracy at epoch 0.
- Rises gradually to ~75% by epoch 50.
- Exhibits minor fluctuations (e.g., epoch 20–30).
- **Key Trend**: Slowest growth, plateauing near 75%.
#### Spatial Grounding
- **Legend**: Bottom-right corner, clearly associating colors with methods.
- **Lines**:
- Traditional (purple) is the topmost line.
- de Bruijn (green) is the middle line.
- Random Vars (blue) is the bottom line.
---
### Key Observations
1. **Traditional** achieves the highest accuracy (~95–98%) by epoch 10 and maintains it.
2. **de Bruijn** outperforms **Random Vars** throughout, reaching ~90% accuracy by epoch 50.
3. **Random Vars** lags significantly, with accuracy peaking at ~75%.
4. All methods show diminishing returns after epoch 10–20, with accuracy stabilizing.
---
### Interpretation
The graph demonstrates that the **Traditional** method is the most effective, achieving near-optimal accuracy early and maintaining it. **de Bruijn** is a strong second, while **Random Vars** underperforms, suggesting inefficiency or suboptimal parameter selection. The plateauing trends imply that further training beyond 20–30 epochs yields minimal gains, highlighting potential overfitting or saturation in the models. The stark difference between Traditional and Random Vars may indicate architectural or algorithmic advantages in the former.