## Bar Chart: Exact Match Performance on VCR EN Dataset
### Overview
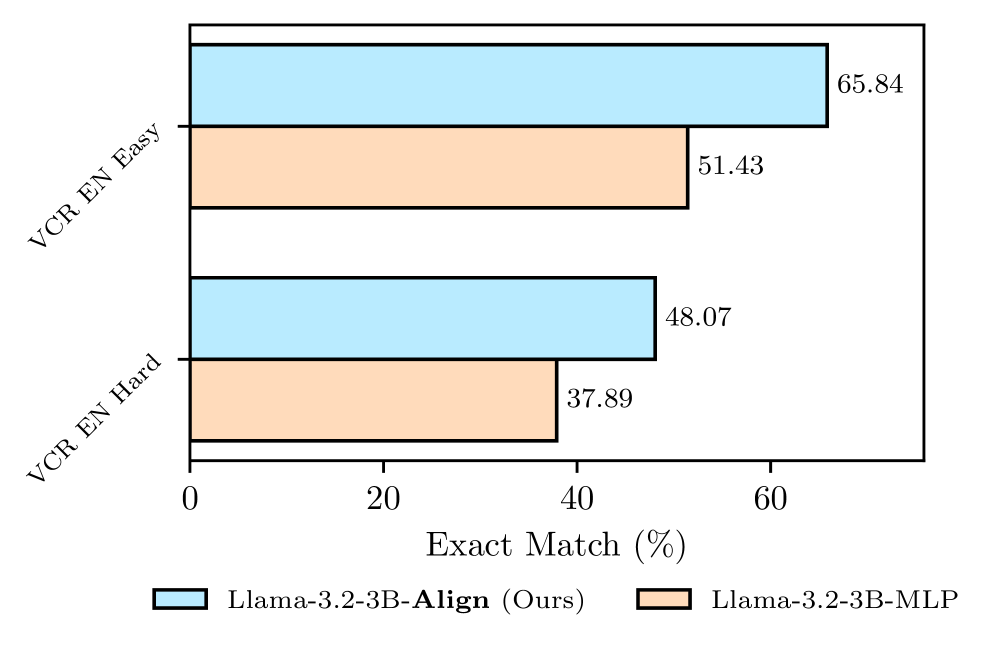
The image is a bar chart comparing the "Exact Match" performance of two models, "Llama-3.2-3B-Align (Ours)" and "Llama-3.2-3B-MLP", on the VCR EN dataset, split into "Easy" and "Hard" difficulty levels. The chart displays the percentage of exact matches achieved by each model on each difficulty level.
### Components/Axes
* **Y-axis:** "VCR EN Easy" and "VCR EN Hard" representing the two difficulty levels of the VCR EN dataset.
* **X-axis:** "Exact Match (%)" ranging from 0 to 60, indicating the percentage of exact matches.
* **Legend:** Located at the bottom of the chart.
* Light Blue: "Llama-3.2-3B-Align (Ours)"
* Light Orange: "Llama-3.2-3B-MLP"
### Detailed Analysis
* **VCR EN Easy:**
* Llama-3.2-3B-Align (Ours) (Light Blue): 65.84%
* Llama-3.2-3B-MLP (Light Orange): 51.43%
* **VCR EN Hard:**
* Llama-3.2-3B-Align (Ours) (Light Blue): 48.07%
* Llama-3.2-3B-MLP (Light Orange): 37.89%
### Key Observations
* For both "Easy" and "Hard" difficulty levels, "Llama-3.2-3B-Align (Ours)" outperforms "Llama-3.2-3B-MLP" in terms of "Exact Match (%)".
* Both models achieve higher "Exact Match (%)" on the "Easy" split compared to the "Hard" split, as expected.
* The performance gap between the two models is larger on the "Easy" split (65.84% vs 51.43%) compared to the "Hard" split (48.07% vs 37.89%).
### Interpretation
The bar chart demonstrates that the "Llama-3.2-3B-Align (Ours)" model exhibits superior performance compared to the "Llama-3.2-3B-MLP" model on the VCR EN dataset, regardless of the difficulty level. The "Align" model's architecture or training procedure likely contributes to its improved accuracy in achieving exact matches. The larger performance difference on the "Easy" split suggests that the "Align" model is better at handling less complex or ambiguous scenarios within the VCR EN dataset. The drop in performance for both models on the "Hard" split indicates that both models struggle with the more challenging aspects of the dataset.