\n
## Bar Chart: VCR EN Easy/Hard Exact Match Comparison
### Overview
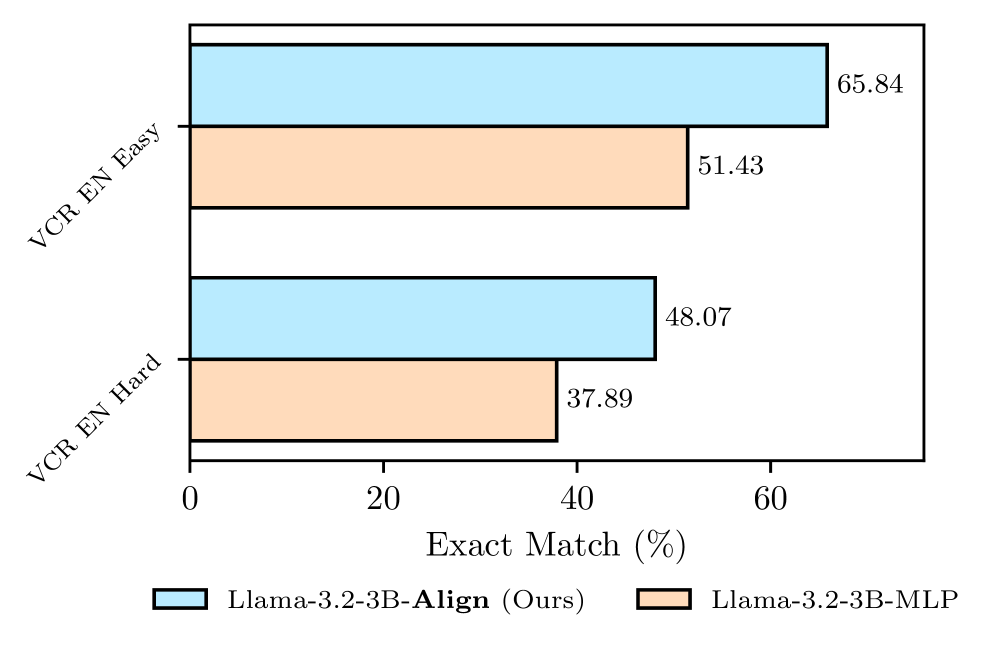
This is a horizontal bar chart comparing the "Exact Match (%)" scores of two models, "Llama-3.2-3B-Align (Ours)" and "Llama-3.2-3B-MLP", on two datasets: "VCR EN Easy" and "VCR EN Hard". The chart visually represents the performance of each model on each dataset using bar lengths proportional to the exact match percentage.
### Components/Axes
* **X-axis:** "Exact Match (%)" - Scale ranges from 0 to 60, with increments of 20.
* **Y-axis:** Two categories: "VCR EN Easy" and "VCR EN Hard".
* **Legend:** Located at the top-right of the chart.
* "Llama-3.2-3B-Align (Ours)" - Represented by a light blue color.
* "Llama-3.2-3B-MLP" - Represented by a light orange color.
### Detailed Analysis
The chart contains four horizontal bars, two for each dataset, representing the performance of each model.
* **VCR EN Easy:**
* "Llama-3.2-3B-Align (Ours)" - The light blue bar extends to approximately 65.84% on the x-axis.
* "Llama-3.2-3B-MLP" - The light orange bar extends to approximately 51.43% on the x-axis.
* **VCR EN Hard:**
* "Llama-3.2-3B-Align (Ours)" - The light blue bar extends to approximately 48.07% on the x-axis.
* "Llama-3.2-3B-MLP" - The light orange bar extends to approximately 37.89% on the x-axis.
### Key Observations
* "Llama-3.2-3B-Align (Ours)" consistently outperforms "Llama-3.2-3B-MLP" on both "VCR EN Easy" and "VCR EN Hard" datasets.
* The performance gap between the two models is larger on the "VCR EN Easy" dataset than on the "VCR EN Hard" dataset.
* Both models exhibit a performance drop when moving from the "Easy" to the "Hard" dataset, as expected.
### Interpretation
The data suggests that the "Llama-3.2-3B-Align (Ours)" model is more effective at achieving exact matches in the VCR (Visual Commonsense Reasoning) task compared to the "Llama-3.2-3B-MLP" model. The larger performance difference on the "Easy" dataset indicates that the alignment process may be particularly beneficial for simpler reasoning tasks. The decrease in performance for both models on the "Hard" dataset highlights the increased difficulty of the task when presented with more complex scenarios. The chart demonstrates the effectiveness of the alignment process in improving the model's ability to provide exact matches, particularly in less challenging contexts. The data points suggest a clear advantage for the "Ours" model, and the consistent trend across both difficulty levels strengthens this conclusion.