# Technical Document Extraction: Bar Chart Analysis
## Chart Type
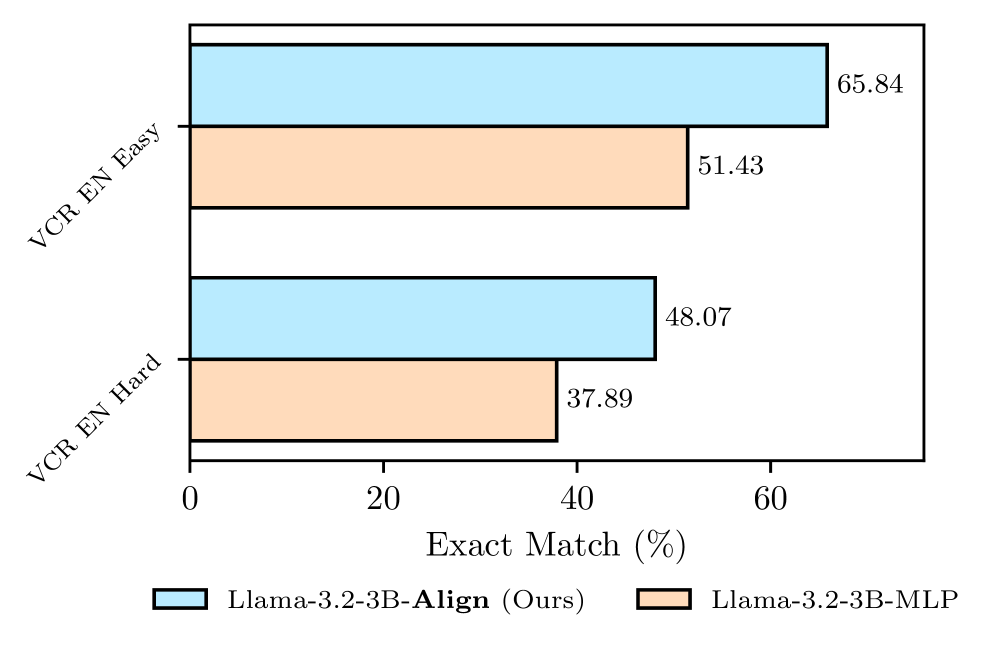
Bar chart comparing model performance across two evaluation categories.
## Axes Labels
- **X-axis**: "Exact Match (%)" (percentage scale from 0 to 70)
- **Y-axis**: Categorical axis with two labels:
- "VCR EN Easy"
- "VCR EN Hard"
## Legend
- **Placement**: Bottom of chart
- **Color Coding**:
- `Blue`: Llama-3.2-3B-Align (Ours)
- `Orange`: Llama-3.2-3B-MLP
## Data Points
### VCR EN Easy
- **Llama-3.2-3B-Align**: 65.84% (Blue bar)
- **Llama-3.2-3B-MLP**: 51.43% (Orange bar)
### VCR EN Hard
- **Llama-3.2-3B-Align**: 48.07% (Blue bar)
- **Llama-3.2-3B-MLP**: 37.89% (Orange bar)
## Visual Trends
1. **Performance Gap**:
- Align model consistently outperforms MLP in both categories
- Largest gap in "VCR EN Easy" (14.41% difference)
- Smaller gap in "VCR EN Hard" (10.18% difference)
2. **Category Performance**:
- Both models show higher performance in "VCR EN Easy" vs "VCR EN Hard"
- Align maintains absolute advantage across all metrics
## Spatial Grounding
- Legend positioned at bottom center
- Bars aligned vertically under respective category labels
- Color consistency verified: Blue bars match Align legend, Orange bars match MLP legend
## Technical Observations
- Chart uses percentage-based visualization for direct performance comparison
- Error bars not present; data appears to represent mean values
- No additional annotations or statistical significance markers visible
## Language Analysis
- All text in English
- No non-English content detected
## Data Reconstruction Table
| Category | Llama-3.2-3B-Align | Llama-3.2-3B-MLP |
|----------------|--------------------|------------------|
| VCR EN Easy | 65.84% | 51.43% |
| VCR EN Hard | 48.07% | 37.89% |
## Conclusion
The chart demonstrates that the Llama-3.2-3B-Align model achieves superior exact match performance across both evaluation categories compared to the MLP baseline, with particularly strong performance in the "VCR EN Easy" category.