## Line Chart: Codebook Entropy vs. Training Steps
### Overview
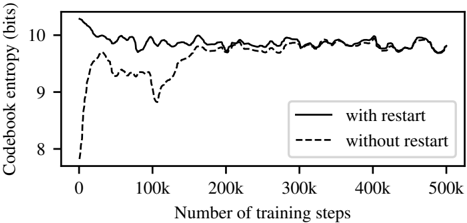
This image displays a line chart comparing the "Codebook entropy (bits)" over the course of 500,000 training steps for two distinct experimental conditions: "with restart" and "without restart." The chart illustrates how the entropy of the codebook evolves during the training process, highlighting a significant divergence in early training stages followed by convergence.
### Components/Axes
* **Y-Axis:** Labeled "Codebook entropy (bits)". The scale ranges from 8 to 10, with tick marks at 8, 9, and 10.
* **X-Axis:** Labeled "Number of training steps". The scale ranges from 0 to 500k, with major tick marks at 0, 100k, 200k, 300k, 400k, and 500k.
* **Legend:** Positioned in the middle-right area of the chart.
* **Solid line:** Represents "with restart".
* **Dashed line:** Represents "without restart".
### Detailed Analysis
The chart tracks two data series across 500,000 steps:
**1. Solid Line ("with restart")**
* **Trend:** The line begins at a high entropy value of approximately 10.3 at step 0. It exhibits a rapid downward trend until approximately 50k steps, where it reaches a value of roughly 9.9. From 50k steps through 500k steps, the line remains relatively stable, oscillating within a narrow band between 9.7 and 9.9.
**2. Dashed Line ("without restart")**
* **Trend:** The line begins at a very low entropy value of approximately 7.8 at step 0. It rises sharply between 0 and 40k steps, reaching a local peak of approximately 9.6. Following this, it experiences a period of instability:
* It dips to approximately 9.3 around 60k steps.
* It drops further to a local minimum of approximately 8.8 at 100k steps.
* It then rises sharply between 100k and 150k steps, recovering to approximately 9.7.
* From 200k steps to 500k steps, the dashed line tracks very closely with the solid line, oscillating in the same 9.7–9.9 range.
### Key Observations
* **Early Divergence:** There is a stark difference in behavior between the two models before the 200k step mark. The "with restart" model maintains high entropy from the start, whereas the "without restart" model starts with low entropy and undergoes a significant "dip" (collapse) around 100k steps.
* **Convergence:** By the 200k step mark, both models converge to a similar entropy level.
* **Stability:** The "with restart" model demonstrates higher stability in the early phases of training compared to the "without restart" model.
### Interpretation
This data is characteristic of training dynamics in vector quantization models (such as VQ-VAEs).
* **Codebook Collapse:** The low entropy at the start of the "without restart" line (and the dip at 100k) suggests that the model is suffering from "codebook collapse," where only a small subset of the available codebook vectors are being utilized.
* **The Role of "Restart":** The "with restart" mechanism appears to be a technique designed to prevent this collapse. By resetting the codebook or the model state, the system forces the model to utilize a wider variety of codes early on, maintaining higher entropy.
* **Long-term Equivalence:** The fact that both lines converge after 200k steps suggests that while the "restart" mechanism is crucial for avoiding early-stage failure or poor initialization, it may not significantly alter the final capacity or entropy limit of the model once it has successfully stabilized. The "restart" is essentially a "safety net" for the initial training phase.