## Scatter Plot: Performance vs Step
### Overview
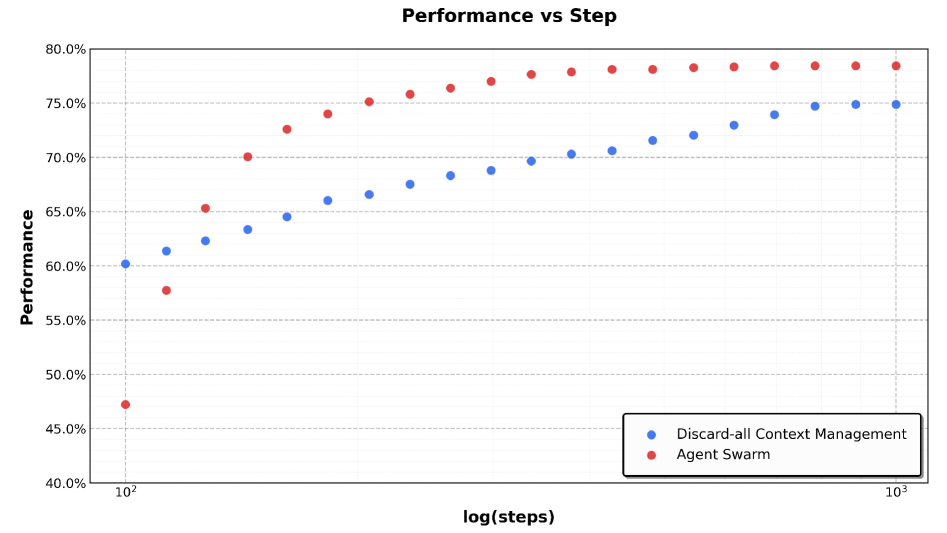
The image is a scatter plot comparing the performance of two different strategies, "Discard-all Context Management" and "Agent Swarm", against the logarithm of the number of steps. The x-axis represents log(steps), and the y-axis represents performance, measured as a percentage. The plot shows how the performance of each strategy changes as the number of steps increases.
### Components/Axes
* **Title:** Performance vs Step
* **X-axis:** log(steps). The x-axis is on a logarithmic scale. The axis markers are 10<sup>2</sup> and 10<sup>3</sup>.
* **Y-axis:** Performance. The y-axis is a linear scale ranging from 40.0% to 80.0%, with tick marks at every 5% increment (40.0%, 45.0%, 50.0%, 55.0%, 60.0%, 65.0%, 70.0%, 75.0%, 80.0%).
* **Legend:** Located in the bottom-right corner of the plot.
* Blue: Discard-all Context Management
* Red: Agent Swarm
### Detailed Analysis
* **Discard-all Context Management (Blue):**
* The blue data series represents the "Discard-all Context Management" strategy.
* The line slopes upward, indicating that performance increases with the number of steps.
* At log(steps) = 10<sup>2</sup>, the performance is approximately 60%.
* At log(steps) = 10<sup>3</sup>, the performance is approximately 75%.
* Key data points: (10<sup>2</sup>, 60%), (316, 68%), (10<sup>3</sup>, 75%)
* **Agent Swarm (Red):**
* The red data series represents the "Agent Swarm" strategy.
* The line slopes upward, indicating that performance increases with the number of steps.
* The performance increases rapidly initially and then plateaus.
* At log(steps) = 10<sup>2</sup>, the performance is approximately 47%.
* At log(steps) = 10<sup>3</sup>, the performance is approximately 78%.
* Key data points: (10<sup>2</sup>, 47%), (141, 58%), (215, 65%), (316, 74%), (10<sup>3</sup>, 78%)
### Key Observations
* The "Agent Swarm" strategy starts with a lower performance but quickly catches up and surpasses the "Discard-all Context Management" strategy.
* The "Agent Swarm" strategy plateaus at a higher performance level than the "Discard-all Context Management" strategy.
* Both strategies show improved performance as the number of steps increases.
### Interpretation
The scatter plot demonstrates that both "Discard-all Context Management" and "Agent Swarm" strategies improve in performance as the number of steps increases. However, the "Agent Swarm" strategy exhibits a faster initial improvement and reaches a higher plateau, suggesting it is a more effective strategy in the long run. The logarithmic scale of the x-axis indicates that the initial steps have a more significant impact on performance improvement than later steps. The "Agent Swarm" strategy's rapid initial improvement suggests it is more efficient at learning or adapting to the environment.