## Scatter Plot: Performance vs Step
### Overview
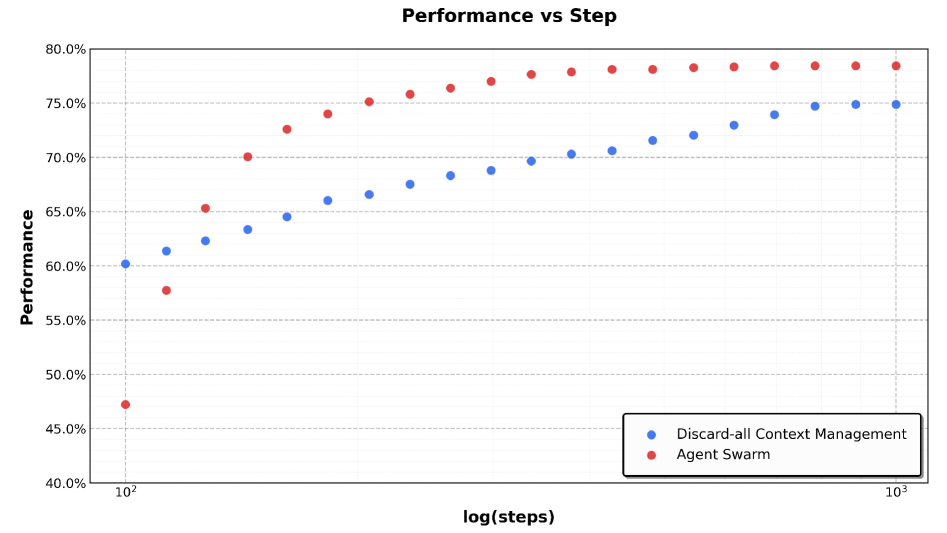
The image presents a scatter plot illustrating the relationship between performance and the logarithm of steps taken. Two distinct data series are plotted, representing "Discard-all Context Management" and "Agent Swarm" approaches. The x-axis represents the log of steps, ranging from approximately 10^2 to 10^3, while the y-axis represents performance, ranging from approximately 40% to 80%.
### Components/Axes
* **Title:** "Performance vs Step" - positioned at the top-center of the chart.
* **X-axis Label:** "log(steps)" - positioned at the bottom-center of the chart. The scale is logarithmic, with markers at 10^2 and 10^3.
* **Y-axis Label:** "Performance" - positioned at the left-center of the chart. The scale is linear, ranging from 40.0% to 80.0% with increments of 5.0%.
* **Legend:** Located at the bottom-right corner of the chart.
* "Discard-all Context Management" - represented by blue circles.
* "Agent Swarm" - represented by red circles.
* **Gridlines:** Horizontal gridlines are present, aiding in reading the performance values.
### Detailed Analysis
**Discard-all Context Management (Blue Circles):**
The blue data series shows a generally upward trend, but with diminishing returns. Initially, the performance increases more rapidly, then plateaus.
* At log(steps) ≈ 10^2 (approximately 100), performance is approximately 61%.
* At log(steps) ≈ 150, performance is approximately 63%.
* At log(steps) ≈ 200, performance is approximately 65%.
* At log(steps) ≈ 300, performance is approximately 67%.
* At log(steps) ≈ 400, performance is approximately 69%.
* At log(steps) ≈ 500, performance is approximately 70%.
* At log(steps) ≈ 600, performance is approximately 71%.
* At log(steps) ≈ 700, performance is approximately 72%.
* At log(steps) ≈ 800, performance is approximately 73%.
* At log(steps) ≈ 900, performance is approximately 74%.
* At log(steps) ≈ 10^3 (approximately 1000), performance is approximately 75%.
**Agent Swarm (Red Circles):**
The red data series shows a rapid initial increase in performance, followed by a plateau at a higher performance level than the blue series.
* At log(steps) ≈ 10^2 (approximately 100), performance is approximately 44%.
* At log(steps) ≈ 120, performance is approximately 55%.
* At log(steps) ≈ 150, performance is approximately 64%.
* At log(steps) ≈ 200, performance is approximately 70%.
* At log(steps) ≈ 250, performance is approximately 73%.
* At log(steps) ≈ 300, performance is approximately 75%.
* From log(steps) ≈ 300 to 10^3, performance remains relatively stable, fluctuating between approximately 75% and 78%.
* At log(steps) ≈ 10^3 (approximately 1000), performance is approximately 78%.
### Key Observations
* The "Agent Swarm" approach consistently outperforms the "Discard-all Context Management" approach across the entire range of steps.
* Both approaches exhibit diminishing returns in performance as the number of steps increases.
* The "Agent Swarm" approach shows a more significant initial performance gain compared to the "Discard-all Context Management" approach.
* The "Agent Swarm" approach reaches a performance plateau much earlier than the "Discard-all Context Management" approach.
### Interpretation
The data suggests that the "Agent Swarm" approach is more effective at achieving higher performance levels, particularly in the initial stages of the process. However, both approaches eventually reach a point of diminishing returns, indicating that further increasing the number of steps does not significantly improve performance. The logarithmic scale on the x-axis implies that the cost of each additional step increases as the number of steps grows, and the performance gains do not justify the increased cost beyond a certain point. The plateau observed in both series could indicate a fundamental limit to the performance achievable with these approaches, or it could suggest that other factors are becoming limiting. The difference in the initial performance gain between the two approaches suggests that the "Agent Swarm" approach is better at leveraging early information or adapting to the task at hand. The consistent outperformance of "Agent Swarm" suggests it is a more robust strategy.