## Scatter Plot: Performance vs Step
### Overview
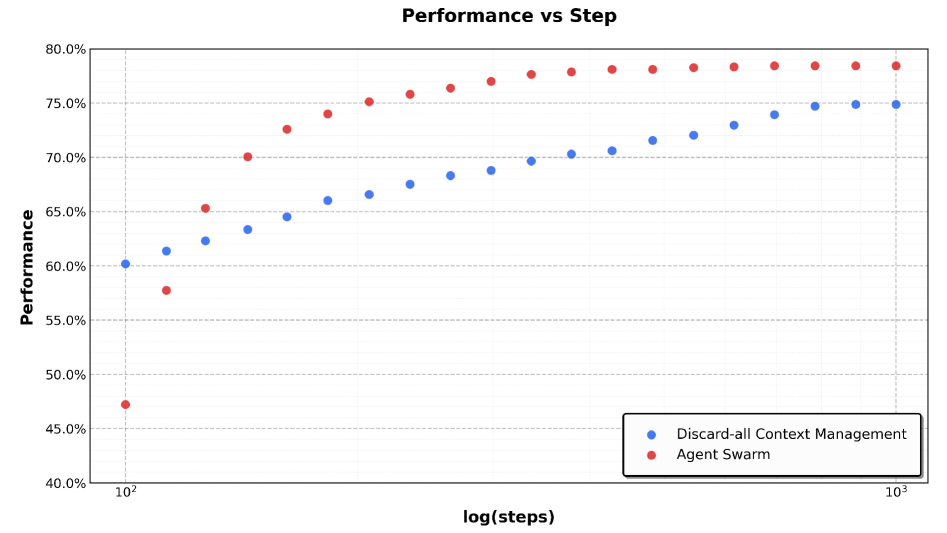
The image is a scatter plot comparing the performance of two different methods, "Discard-all Context Management" and "Agent Swarm," as a function of training steps plotted on a logarithmic scale. The chart demonstrates how the performance metric (in percentage) evolves for each method as the number of steps increases from 100 (10²) to 1000 (10³).
### Components/Axes
* **Title:** "Performance vs Step"
* **Y-Axis:**
* **Label:** "Performance"
* **Scale:** Linear, ranging from 40.0% to 80.0%.
* **Major Tick Marks:** 40.0%, 45.0%, 50.0%, 55.0%, 60.0%, 65.0%, 70.0%, 75.0%, 80.0%.
* **X-Axis:**
* **Label:** "log(steps)"
* **Scale:** Logarithmic (base 10).
* **Major Tick Mark Labels:** 10² (100) and 10³ (1000).
* **Legend:**
* **Position:** Bottom-right corner of the plot area.
* **Entry 1:** Blue circle marker, labeled "Discard-all Context Management".
* **Entry 2:** Red circle marker, labeled "Agent Swarm".
* **Plot Area:** Contains a grid of light gray dashed lines aligned with the major y-axis ticks.
### Detailed Analysis
The plot displays two distinct data series, each represented by a set of colored circles. The trend for each series is described before listing approximate data points.
**1. Discard-all Context Management (Blue Series)**
* **Trend:** The blue data points show a steady, monotonic upward trend that begins to plateau at higher step counts. The rate of improvement slows as steps increase.
* **Approximate Data Points (Step, Performance):**
* (100, ~60.0%)
* (~125, ~61.5%)
* (~160, ~62.5%)
* (~200, ~63.5%)
* (~250, ~64.5%)
* (~315, ~66.0%)
* (~400, ~67.0%)
* (~500, ~68.0%)
* (~630, ~69.0%)
* (~795, ~70.0%)
* (~1000, ~75.0%) - *Note: The final point shows a significant jump, potentially indicating a measurement at exactly 1000 steps.*
**2. Agent Swarm (Red Series)**
* **Trend:** The red data points show a steep, monotonic upward trend that surpasses the blue series after an initial lower starting point. It also shows signs of plateauing but at a higher performance level.
* **Approximate Data Points (Step, Performance):**
* (100, ~47.5%) - *Notable outlier, significantly lower than the blue series at the same step.*
* (~125, ~58.0%)
* (~160, ~65.5%)
* (~200, ~70.0%)
* (~250, ~73.0%)
* (~315, ~74.0%)
* (~400, ~75.0%)
* (~500, ~76.0%)
* (~630, ~77.0%)
* (~795, ~78.0%)
* (~1000, ~78.5%)
### Key Observations
1. **Performance Crossover:** The "Agent Swarm" method starts with lower performance than "Discard-all Context Management" at 100 steps but overtakes it before 200 steps and maintains a consistent lead thereafter.
2. **Diminishing Returns:** Both methods exhibit diminishing returns; the performance gain per unit of step (on a log scale) decreases as the total number of steps increases.
3. **Final Performance Gap:** At 1000 steps, "Agent Swarm" achieves a performance of approximately 78.5%, while "Discard-all Context Management" reaches approximately 75.0%, resulting in a ~3.5 percentage point advantage for Agent Swarm.
4. **Initial Anomaly:** The first data point for "Agent Swarm" is a clear outlier, suggesting a possible warm-up period or different initial conditions before rapid improvement begins.
### Interpretation
This chart provides a comparative analysis of learning efficiency and final capability between two context management strategies in an AI or machine learning system.
* **What the data suggests:** The "Agent Swarm" approach demonstrates superior long-term learning efficiency. While it may have a slower or less effective start (as seen at 100 steps), its rate of improvement is greater, allowing it to quickly surpass the baseline "Discard-all" method and achieve a higher asymptotic performance. This suggests that the "Agent Swarm" strategy is more effective at leveraging additional training steps to refine its performance.
* **How elements relate:** The logarithmic x-axis is crucial for interpreting the relationship. It compresses the later stages of training, highlighting that the most significant performance gains for both methods occur in the earlier phases (between 100 and ~400 steps). The consistent vertical separation between the red and blue dots after the crossover point visually quantifies the persistent advantage of the Agent Swarm method.
* **Notable implications:** The plateauing of both curves indicates that simply adding more steps beyond 1000 may yield only marginal improvements for these specific configurations. The initial low performance of Agent Swarm could be a critical factor for applications with strict early-stage performance requirements, whereas its higher final performance makes it preferable for scenarios where maximum capability is the goal and longer training is feasible. The data argues that "Agent Swarm" is a more scalable and ultimately more powerful strategy, albeit with a potential cost in early training efficiency.