## Bar Chart: Model Accuracy Across Scientific Disciplines
### Overview
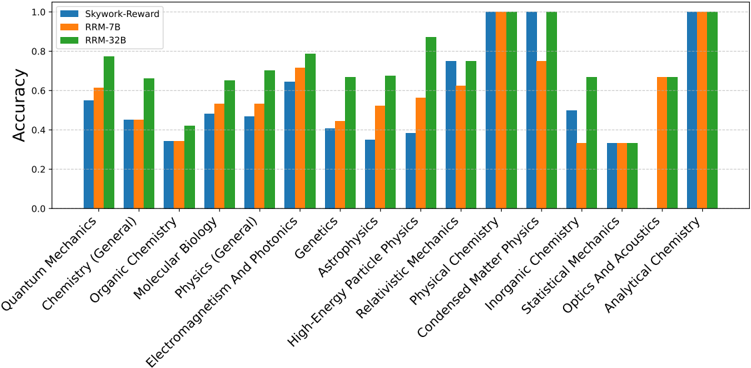
The chart compares the accuracy of three AI models (Skywork-Reward, RRM-7B, RRM-32B) across 15 scientific disciplines. Each discipline has three grouped bars representing the models' performance, with accuracy measured on a 0-1 scale.
### Components/Axes
- **X-axis**: Scientific disciplines (e.g., Quantum Mechanics, Chemistry, Genetics)
- **Y-axis**: Accuracy (0.0 to 1.0)
- **Legend**:
- Blue: Skywork-Reward
- Orange: RRM-7B
- Green: RRM-32B
- **Bar Groups**: Each discipline has three bars (one per model)
### Detailed Analysis
1. **Quantum Mechanics**:
- Skywork-Reward: ~0.55
- RRM-7B: ~0.60
- RRM-32B: ~0.78
2. **Chemistry (General)**:
- Skywork-Reward: ~0.45
- RRM-7B: ~0.45
- RRM-32B: ~0.65
3. **Organic Chemistry**:
- Skywork-Reward: ~0.35
- RRM-7B: ~0.35
- RRM-32B: ~0.42
4. **Molecular Biology**:
- Skywork-Reward: ~0.48
- RRM-7B: ~0.53
- RRM-32B: ~0.63
5. **Physics (General)**:
- Skywork-Reward: ~0.46
- RRM-7B: ~0.52
- RRM-32B: ~0.65
6. **Electromagnetism And Photonics**:
- Skywork-Reward: ~0.63
- RRM-7B: ~0.70
- RRM-32B: ~0.78
7. **Genetics**:
- Skywork-Reward: ~0.40
- RRM-7B: ~0.43
- RRM-32B: ~0.65
8. **Astrophysics**:
- Skywork-Reward: ~0.35
- RRM-7B: ~0.50
- RRM-32B: ~0.67
9. **High-Energy Particle Physics**:
- Skywork-Reward: ~0.40
- RRM-7B: ~0.55
- RRM-32B: ~0.70
10. **Relativistic Mechanics**:
- Skywork-Reward: ~0.55
- RRM-7B: ~0.60
- RRM-32B: ~0.75
11. **Physical Chemistry**:
- Skywork-Reward: ~0.75
- RRM-7B: ~0.75
- RRM-32B: ~0.75
12. **Condensed Matter Physics**:
- Skywork-Reward: ~0.75
- RRM-7B: ~0.75
- RRM-32B: ~0.75
13. **Inorganic Chemistry**:
- Skywork-Reward: ~0.50
- RRM-7B: ~0.30
- RRM-32B: ~0.65
14. **Statistical Mechanics**:
- Skywork-Reward: ~0.30
- RRM-7B: ~0.30
- RRM-32B: ~0.30
15. **Optics And Acoustics**:
- Skywork-Reward: ~0.65
- RRM-7B: ~0.65
- RRM-32B: ~0.65
16. **Analytical Chemistry**:
- Skywork-Reward: ~0.65
- RRM-7B: ~0.65
- RRM-32B: ~0.65
### Key Observations
- **RRM-32B Dominance**: Consistently outperforms other models in most disciplines (e.g., Genetics: 0.65 vs. 0.40 for Skywork-Reward).
- **Skywork-Reward Weaknesses**: Struggles in Organic Chemistry (0.35) and Statistical Mechanics (0.30).
- **RRM-7B Mid-Range Performance**: Often bridges the gap between Skywork-Reward and RRM-32B (e.g., Molecular Biology: 0.53 vs. 0.48 and 0.63).
- **Statistical Mechanics Anomaly**: All models perform equally poorly (~0.30), suggesting a universal challenge in this field.
### Interpretation
The data demonstrates that **RRM-32B** is the most robust model across disciplines, particularly excelling in complex fields like Genetics and Condensed Matter Physics. Skywork-Reward's lower accuracy in Organic Chemistry and Statistical Mechanics may indicate limitations in handling specialized terminology or probabilistic reasoning. RRM-7B's consistent mid-range performance suggests it could serve as a reliable alternative when RRM-32B's higher computational demands are prohibitive. The uniform low performance in Statistical Mechanics highlights a potential gap in current models' ability to handle statistical thermodynamics concepts.