# Technical Document Extraction: Line Chart Analysis
## Header
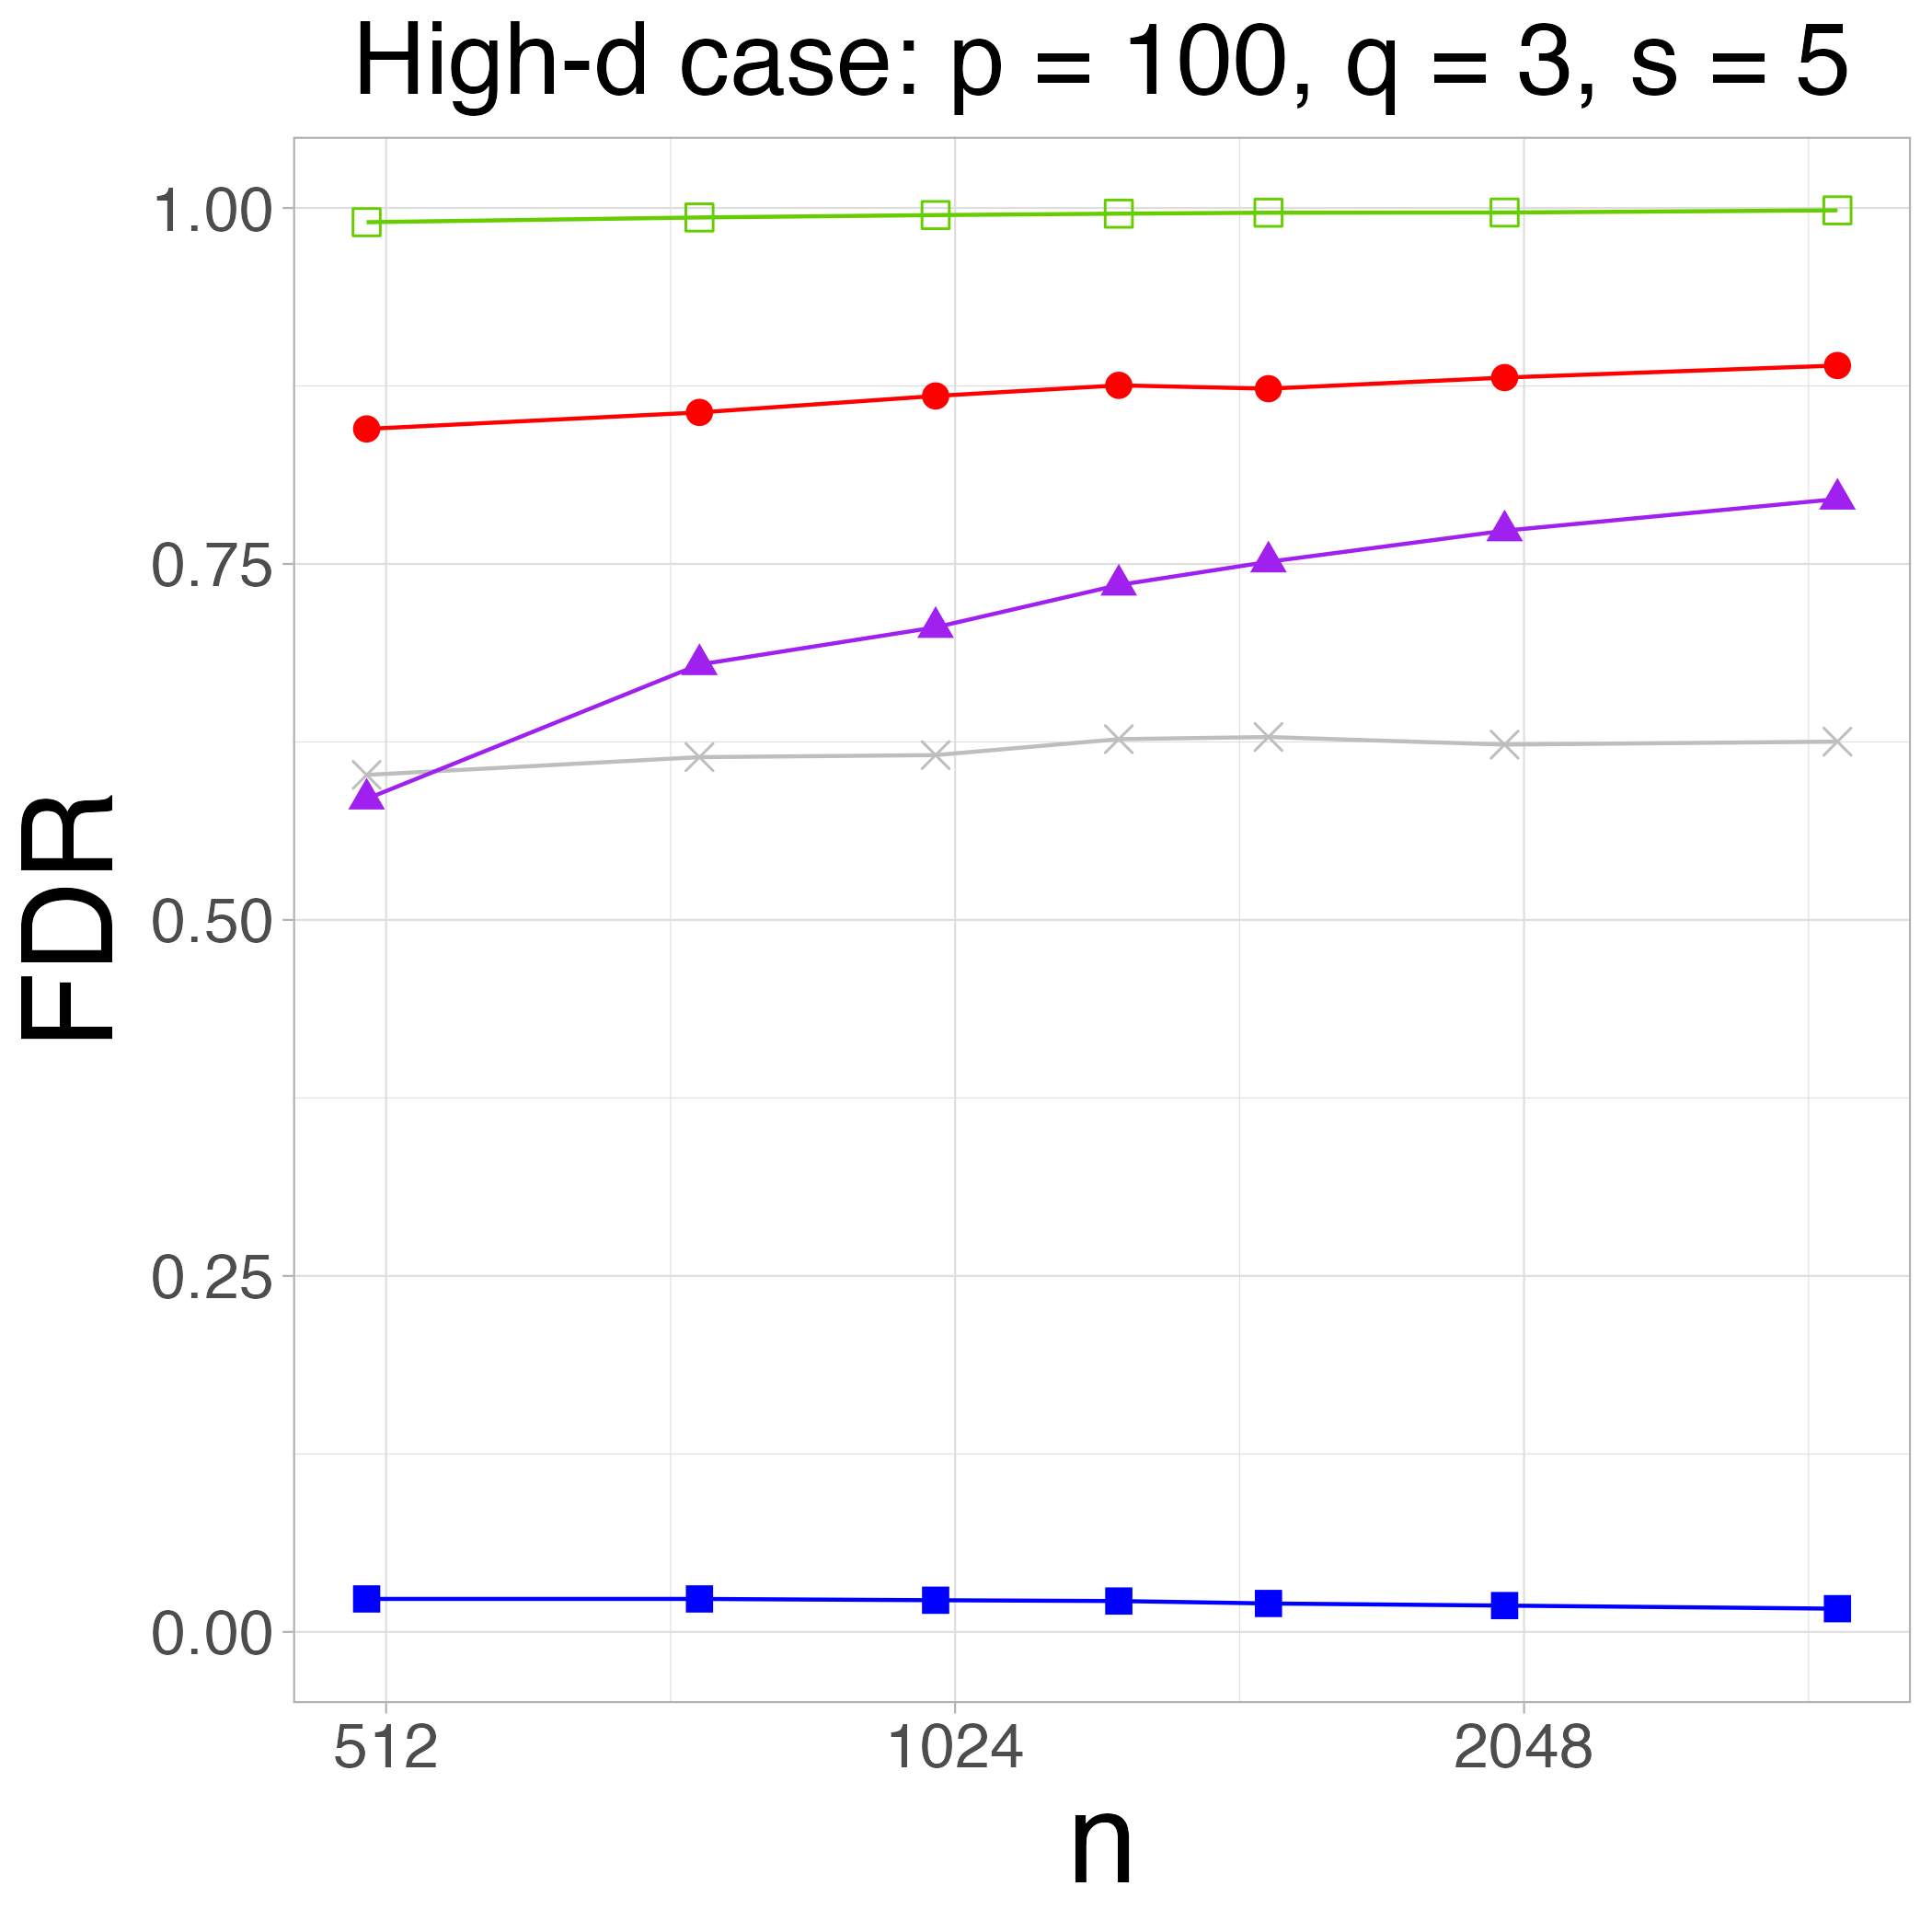
- **Title**: "High-d case: p = 100, q = 3, s = 5"
- **Language**: English (no non-English text detected)
## Main Chart
### Axes
- **X-axis (Horizontal)**:
- Label: `n`
- Values: `512`, `1024`, `2048`
- **Y-axis (Vertical)**:
- Label: `FDR`
- Range: `0.00` to `1.00`
### Data Series
1. **Green Squares** (Legend: Top-right, color: green, marker: square)
- **Trend**: Flat line, consistently near `1.00` across all `n` values.
- **Data Points**:
- `n = 512`: `1.00`
- `n = 1024`: `1.00`
- `n = 2048`: `1.00`
2. **Red Circles** (Legend: Second from top, color: red, marker: circle)
- **Trend**: Slight upward slope, increasing marginally with `n`.
- **Data Points**:
- `n = 512`: `~0.85`
- `n = 1024`: `~0.87`
- `n = 2048`: `~0.88`
3. **Purple Triangles** (Legend: Third from top, color: purple, marker: triangle)
- **Trend**: Steady upward slope, increasing significantly with `n`.
- **Data Points**:
- `n = 512`: `~0.60`
- `n = 1024`: `~0.70`
- `n = 2048`: `~0.80`
4. **Blue Squares** (Legend: Bottom, color: blue, marker: square)
- **Trend**: Flat line, consistently near `0.00` across all `n` values.
- **Data Points**:
- `n = 512`: `~0.00`
- `n = 1024`: `~0.00`
- `n = 2048`: `~0.00`
### Legend
- **Placement**: Top-right corner of the chart.
- **Entries**:
- Green squares: Topmost line (`FDR ≈ 1.00`).
- Red circles: Second line (`FDR ≈ 0.85–0.88`).
- Purple triangles: Third line (`FDR ≈ 0.60–0.80`).
- Blue squares: Bottom line (`FDR ≈ 0.00`).
## Footer
- No additional text or components present.
## Key Observations
1. The green line (squares) remains constant at `FDR = 1.00`, indicating no change with increasing `n`.
2. The red line (circles) shows a minor upward trend, suggesting a slight increase in FDR as `n` grows.
3. The purple line (triangles) demonstrates a clear upward trend, with FDR rising from `~0.60` to `~0.80` as `n` increases.
4. The blue line (squares) remains at `FDR = 0.00`, indicating no measurable effect across all `n` values.
## Data Table Reconstruction
| n | Green Squares | Red Circles | Purple Triangles | Blue Squares |
|--------|---------------|-------------|------------------|--------------|
| 512 | 1.00 | ~0.85 | ~0.60 | ~0.00 |
| 1024 | 1.00 | ~0.87 | ~0.70 | ~0.00 |
| 2048 | 1.00 | ~0.88 | ~0.80 | ~0.00 |
## Notes
- All data points are visually estimated from the chart; exact numerical values are not explicitly labeled.
- The chart title parameters (`p = 100`, `q = 3`, `s = 5`) are critical contextual metadata but do not directly influence axis labels or data series.